What is reading the tape?
Reading the tape is reading order flow. Prior to candlesticks, charts, and support/resistance levels, traders read the tape to understand transactions.
It’s important to understand this concept as we get an inside look “under the hood” of the stock market to reveal what is actually creating the candles you see on your charts (and what is stopping or helping the candles). Adding this practice to your options trading strategy can seriously help you anticipate where stocks will move next.
There are two parts to tape:
- Time and Sales
- Level 2
Time and Sales
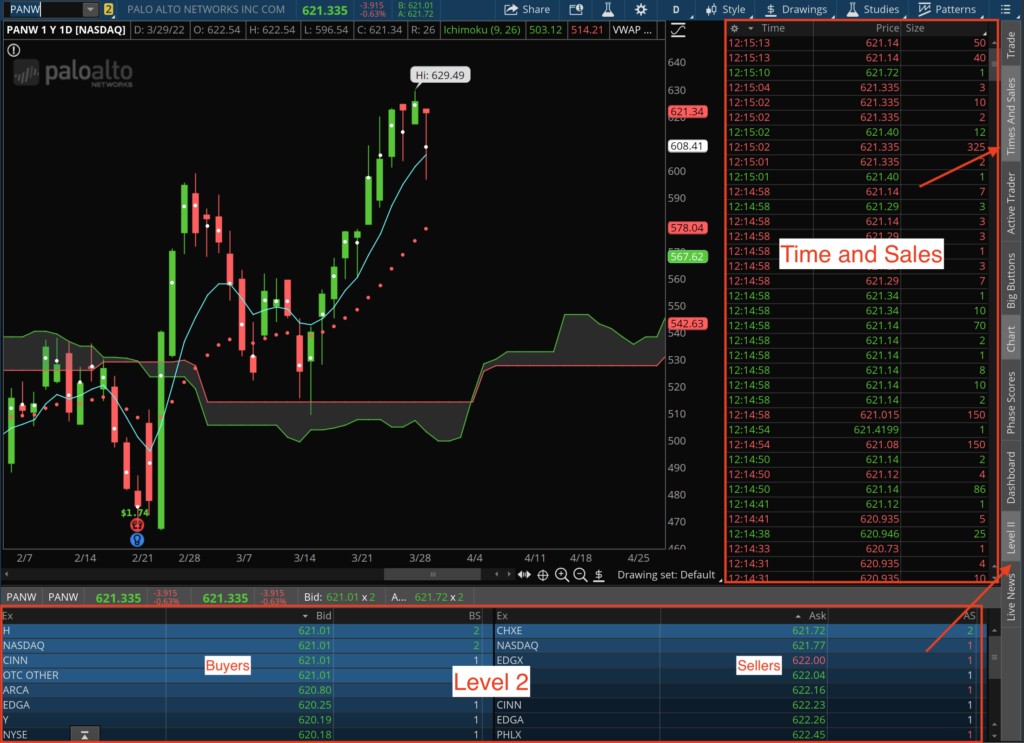
This shows every order going through at a moment in time. You can see the time, price, and size of the actual transactions.
And equally important is…
Level 2
Level 2 is essentially what you picture as the “floor” in the trading pits of Wall Street. This represents the buyers ready and willing to buy (and the sellers ready and willing to sell) with the price and size they agree on with the trade.
On your trading screen, as shown in the image below, think of it as down below is the auction (Level 2) and up above is the results (Time and Sales).
Reading the Tape Trading Strategy
As stocks approach major key levels, we want to look “under the hood” of the market. We want to pull up the tape and see what’s truly going on.
I don’t recommend watching the tape constantly as there will be millions of orders every day. What you can do is look at the tape as the name you’re watching/trading approaches major key levels.
By reading the tape, we can visualize what the stock has to “deal with” to get through a certain level.
You want to ask yourself, “What sellers/buyers and size of orders does the stock have to get through to get past a certain level?”
Case Study: PANW
Let’s take a look at an example of reading the tape on PANW.
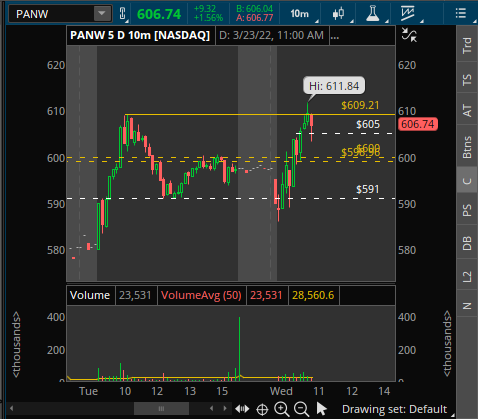
On March 23, PANW was approaching a big level and all-time high (ATH) at $600. PANW ran up to this level, kissed it, and all of a sudden the tape showed a large number of sellers who caused PANW to head lower.
When PANW worked its way back up to $600, the tape showed there weren’t many sellers. This led us to think that we should keep holding PANW, since there is a good chance it would break through $600 due to the lack of sellers.
Once PANW breaks through $600, we want to see the buyers come in and hold PANW at $600.
By reading the tape, we were able to anticipate what might happen next. There was a seller with a large order size at $605, which became the new level PANW had to “deal with.”
This is the power behind the tape, showing how you can use it in trading to anticipate which key levels stocks will move toward or away from next.
If you’d like to watch how we traded PANW in the Simpler Trading Options Gold live-trading room, check out the video below for a real-time visualization of how we read the tape to lock in over 100% return on investment.
How to Read the Tape:
On the Time and Sales tab, the size represents the amount of shares.
However, on Level 2 we need to do a bit of basic math. Whatever the size is, you must multiply that by 100 to get the actual number of shares traded.
For example, if on Level 2 a seller offers a size of 2… We would multiply 2 by 100 and know that the seller offered 200 shares.
If the price was at $615, we would multiply 200 shares by $615. This means that a seller is offering $123,000 for their PANW stock. If and when PANW gets to $615 and the seller is still around, there needs to be enough buyers that want to accumulate $123,000 worth of this stock to get through that key level.
That is why tape is so important.
If you’d like an even deeper dive into reading the tape and how to apply it to my go-to strategy for quick profits daily, check out my 4-hour Options Scalping Secrets course here. I explain my strategy for identifying key levels using my simple indicators to catch big scalping moves daily.
Stay Focused!