The Multi-10x indicator has become a useful tool in our trading arsenal. This indicator has helped narrow down our focus list to only the cleanest setups.
Multi-10x (upgrade to the original 10x Bars) was created by Simpler Trading as a way to monitor trend quality and strength so that we can understand momentum better.
Let’s review one of my favorite swing trading indicators for gauging trend, structure, and momentum.
What are the Multi-10x bars?
The Multi-10x bars are calculated by underlying ADX and DMI indicators and put directly on the chart so the decision-making becomes instantly simpler. The bars are shown as either green, yellow, or red.
To break it down simply:
Green Multi-10x bars = bullish momentum is increasing
Yellow Multi-10x bars = momentum is neutral (no strong directional conviction)
Red Multi-10x bars = bearish momentum is increasing
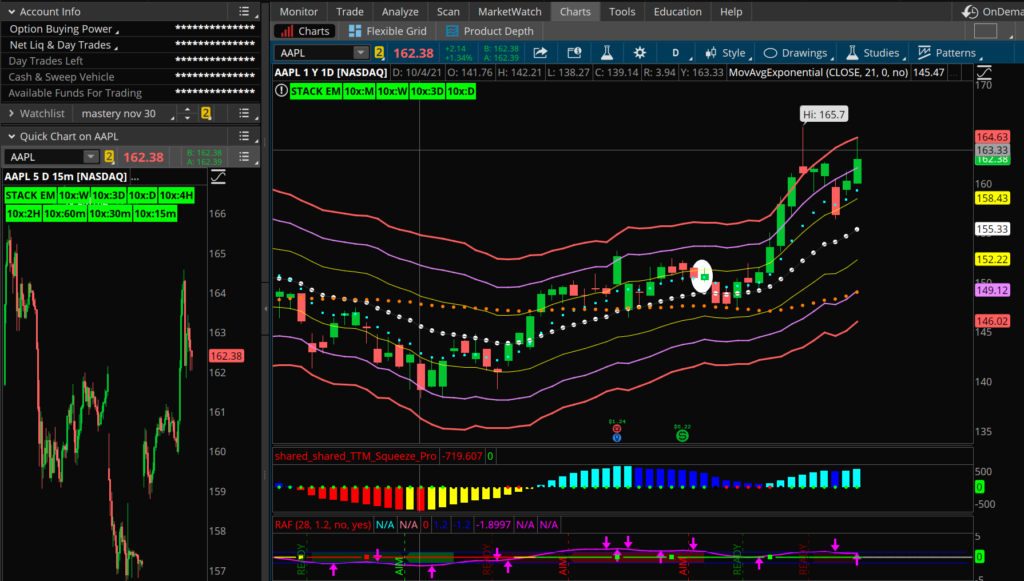
In the image above, you can see green Multi-10x bars on the top left corner of the screen. This shows bullish momentum across multiple time frames: the monthly, weekly, 3-day, and daily time frames.
How do we use Multi-10x?
We want to trade in the direction the Multi-10x bars are signaling, as that implies the best probability of success to trade.
When it comes to yellow bars, we want to either avoid those setups or use non-directional strategies until a stronger conviction of direction is established.
The Multi-10x bars complement the squeeze indicator as together they can confirm whether we want to stay in a trending stock or exit early.
Multi-10x versus original 10x Bars:
The original 10x Bars show colored bars that help identify trend direction and conviction quickly. This indicator is sold separately from the new Multi-10x. The Multi-10x indicator signals trend strength and direction in 18 different time frames shown as green, yellow, or red boxes at the top left corner of the chart. We can use this indicator to pinpoint entries in breakouts and to avoid “fake out” moves.
For more information on purchasing the 10x Bars or the Multi-10x indicator, click HERE.
Settings:
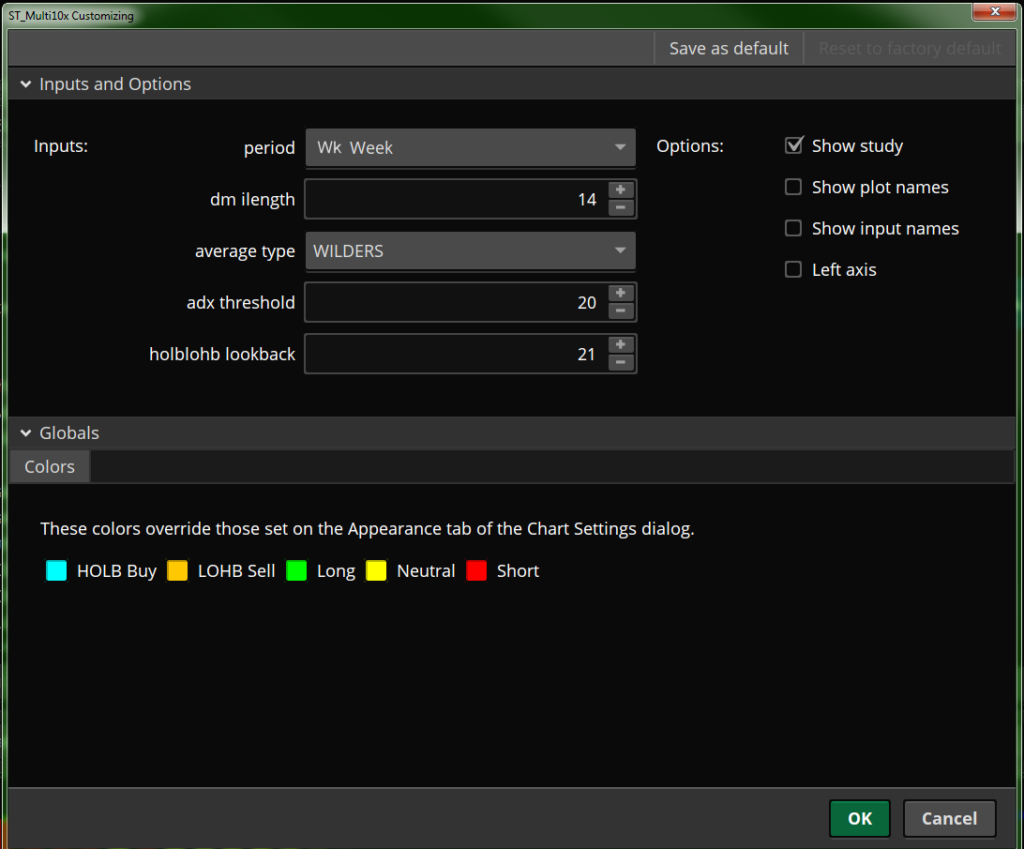
Below you’ll see an example of the settings I have on the Multi-10x indicator. If you want to change the time frame, simply click the “period” options and choose the time frame you’re looking to add.
Example:
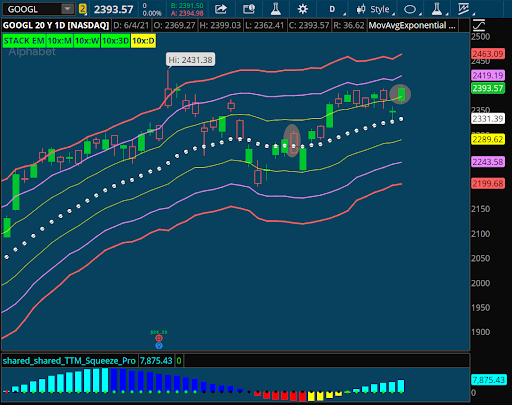
Let’s take a look at an example of a clean setup that fits the bill of my trading criteria, specifically with positive momentum shown by the green 10x bars.
GOOGL Trade:
- Weekly chart has bullish structure
- Daily squeeze at the buy zone
- Stacked exponential moving averages (EMA)
- Green 10x bars show positive momentum
As technology started to regain bullish structure on its daily chart, GOOGL formed a beautiful daily squeeze that fit my criteria. On May 18, 2021, I sold an at-the-money (ATM) put credit spread while GOOGL set up in a daily squeeze. I sold the put credit spread, looking for GOOGL to ultimately fire the squeeze long and run to new all-time highs.
ENTRY 5/18
SOLD -25 VERTICAL GOOGL 100 18 JUN 21 2290/2270P @ 8.13
On June 4, 2021, I bought back my put credit spread for 75% of the max profit. Though the run to new highs didn’t quite unfold, the $100+ move I caught locked in 75% of the max profit on the spread.
EXIT 6/04
BOT + 25 VERTICAL GOOGL 100 18 JUN 21 2290/2270P @ 2.04
The max loss on this trade was $28,675. The profit on this trade was $15,225.
Now that you know what the Multi-10x bars are and how to use them, we hope you can add these to your trading tools to get an additional edge. If you’d like a deeper dive into how I use the Multi-10x bars with my strategy, check out my Compounding Growth Technique four-hour strategy class.
Be sure to check out our Sunday weekly watchlist video for actionable setups that are supported by trend, structure, and momentum.
Stay Focused!