While the overall market was mostly sloppy this week, we saw some great continuation in the trends we mentioned in last week’s newsletter, such as energy, consumer staples, and health care.
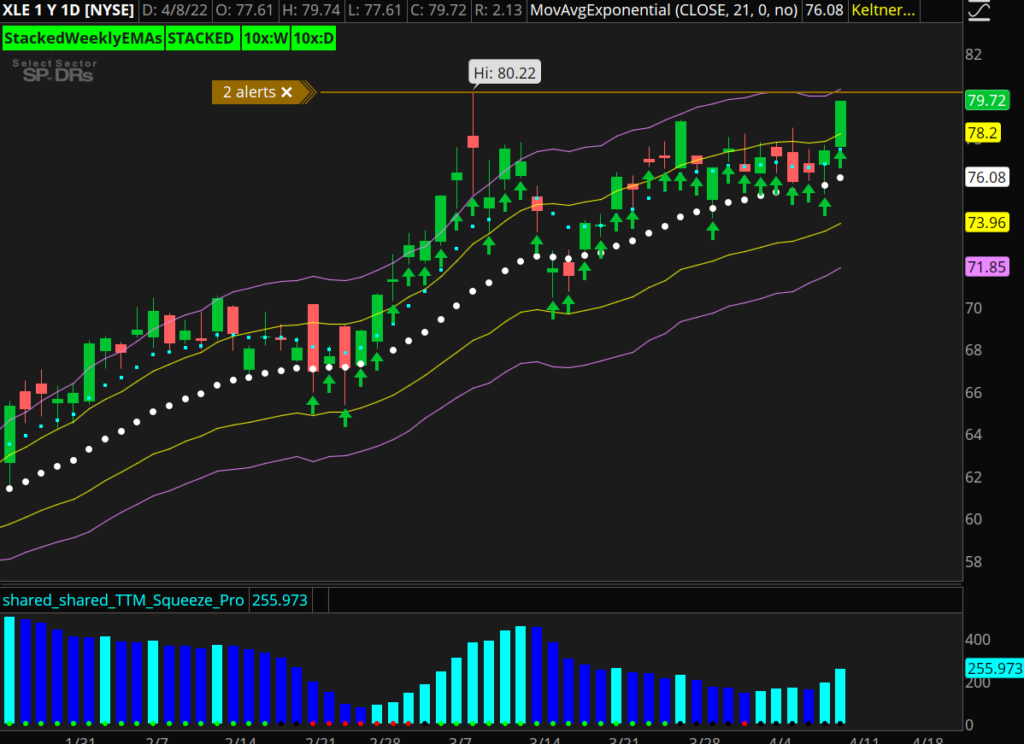
As far as energy (XLE) goes, the daily squeeze looks poised to fire long here, which should be good for a strong push through $80+. With such a solid structure to the ETF (Exchange Traded Fund), the individual names like EOG, DVN, and CVX look ready to run higher as well. At the moment, we’re long XLE call debit spreads for May expiration.
XLE Daily Chart
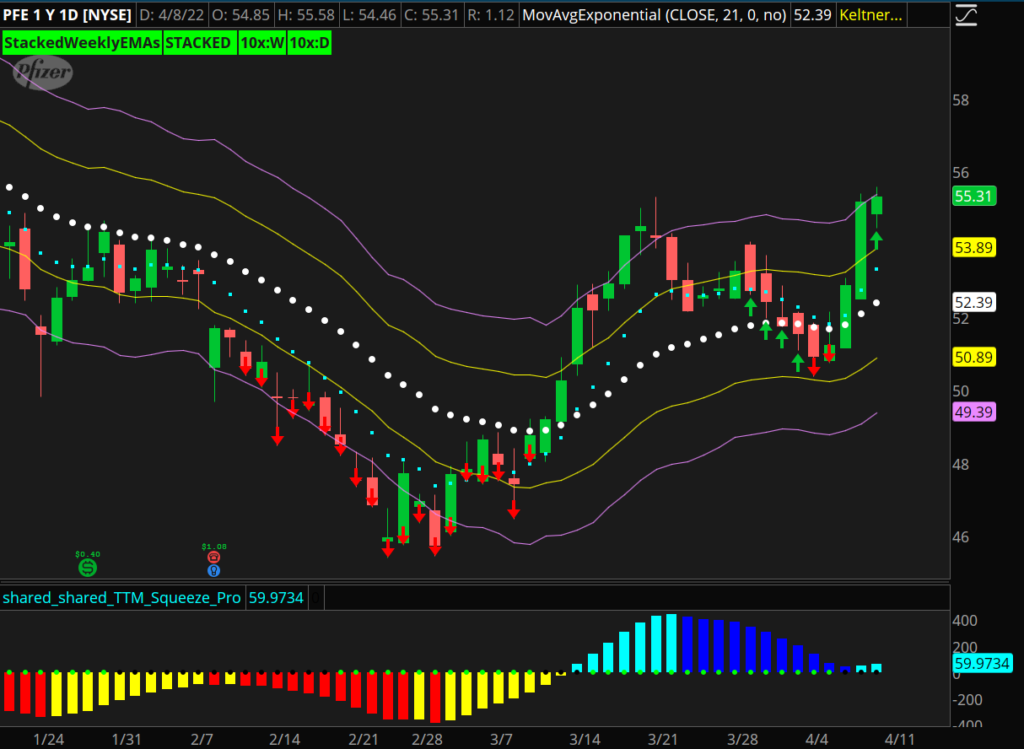
While the health care sector (XLV) is incredibly strong, it’s a bit too extended for an entry at the moment. On any dip, we’ll be watching names like PFE closely for a potential entry.
PFE Daily Chart
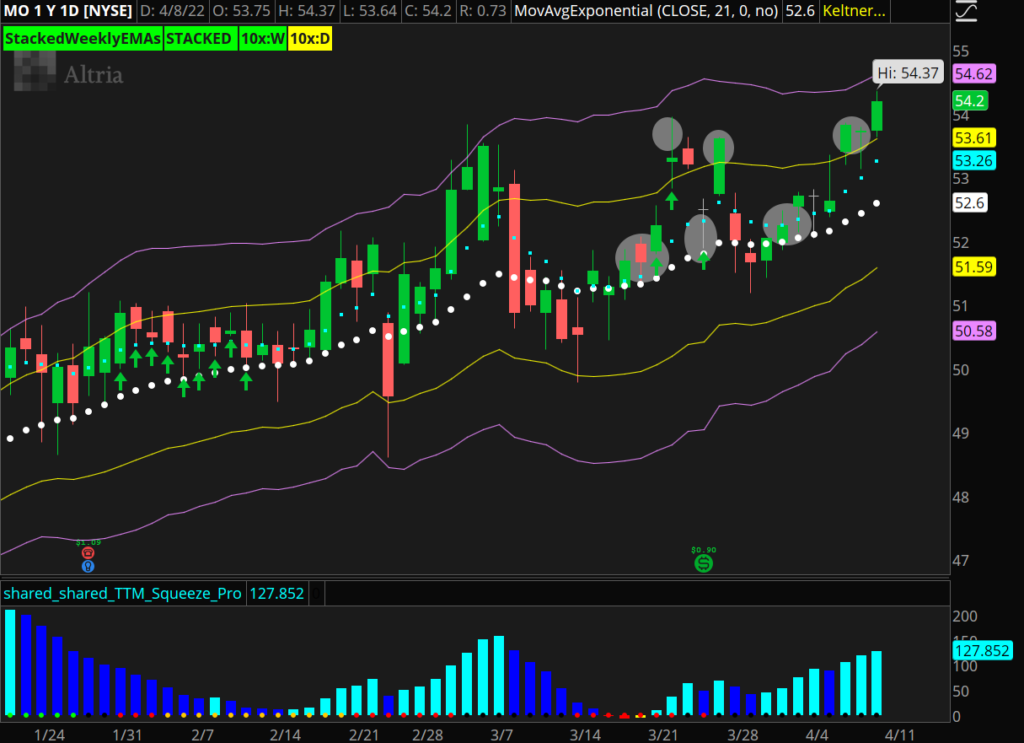
The consumer staples, and MO in particular, have been good to us over the last few weeks as we closed our fourth profitable trade in the setup this week. Since the structure is still in tact, we’ll be looking to jump back into MO, shooting for winning trade #5.
MO Daily Chart
We hope you’re noticing the theme with these setups.
They are all in uptrends and have positively stacked exponential moving averages (EMAs). Getting long these setups will put the “wind at your back”.
In addition to these setups, here’s more we’re watching closely:
CCJ
MOS
RTX
NTR
As you’re preparing for next week, make sure the setups on your watchlist are supported by trend, structure, and momentum working in your favor.
In Sunday’s video, we’ll cover these setups in detail and a handful of others looking poised to make solid moves.
The market is at the critical levels that we previously laid out for April.
The main focus in play is the daily Ichimoku Cloud as it guides us forward.
The S&P 500 (/ES) approached the Cloud top on Thursday, forming a zone from $4,455 to $4,510. We’ll review this key zone along with other inflection points to create a road map for the coming weeks.
The structure in the market is starting to show lower highs for a slight downtrend. In the video above, we’ll discuss the inflection points going forward along with setups on SHOP, NVDA, and TSLA.
If you’d like an even deeper dive on using the Ichimoku Cloud, check out my 4-hour Options Scalping Secrets course here. I explain my strategy for identifying key levels using my simple indicators to catch big scalping moves daily.
Reading the tape is reading order flow. Prior to candlesticks, charts, and support/resistance levels, traders read the tape to understand transactions.
It’s important to understand this concept as we get an inside look “under the hood” of the stock market to reveal what is actually creating the candles you see on your charts (and what is stopping or helping the candles). Adding this practice to your options trading strategy can seriously help you anticipate where stocks will move next.
There are two parts to tape:
Time and Sales
Level 2
Time and Sales
This shows every order going through at a moment in time. You can see the time, price, and size of the actual transactions.
And equally important is…
Level 2
Level 2 is essentially what you picture as the “floor” in the trading pits of Wall Street. This represents the buyers ready and willing to buy (and the sellers ready and willing to sell) with the price and size they agree on with the trade.
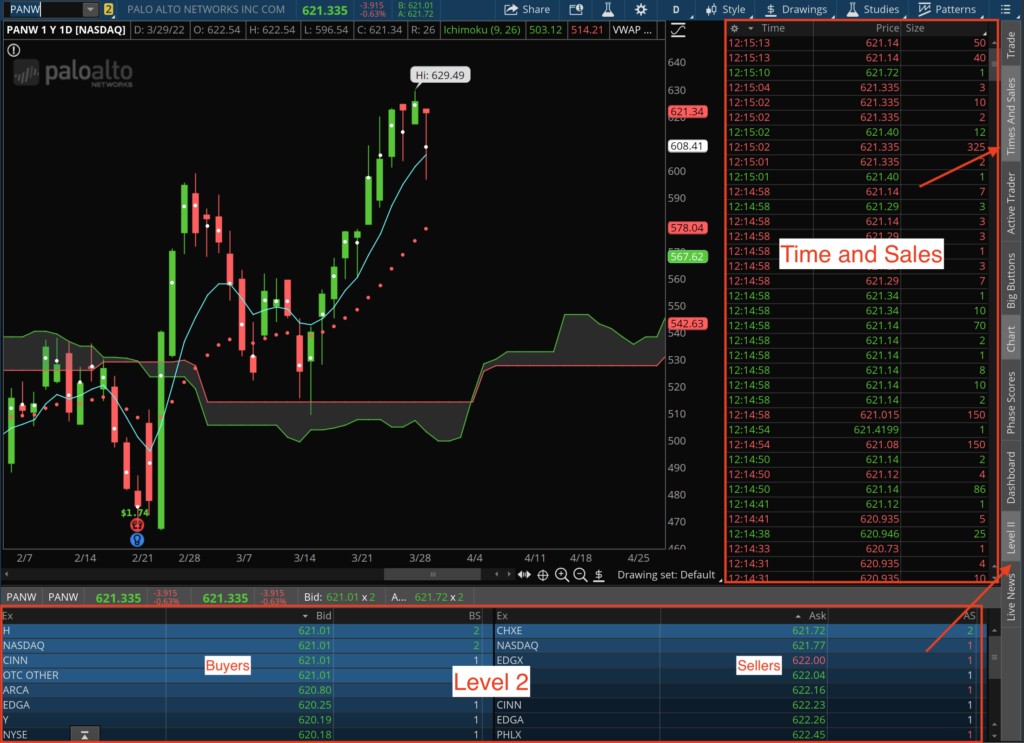
On your trading screen, as shown in the image below, think of it as down below is the auction (Level 2) and up above is the results (Time and Sales).
Reading the Tape Trading Strategy
As stocks approach major key levels, we want to look “under the hood” of the market. We want to pull up the tape and see what’s truly going on.
I don’t recommend watching the tape constantly as there will be millions of orders every day. What you can do is look at the tape as the name you’re watching/trading approaches major key levels.
By reading the tape, we can visualize what the stock has to “deal with” to get through a certain level.
You want to ask yourself, “What sellers/buyers and size of orders does the stock have to get through to get past a certain level?”
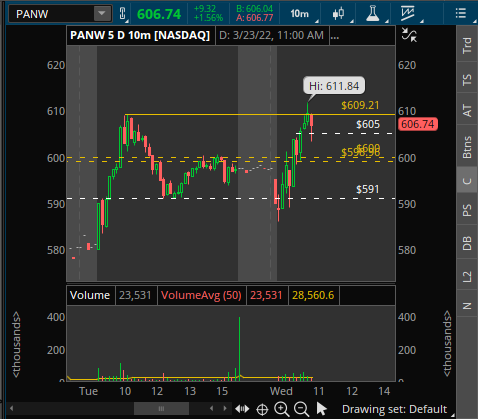
On March 23, PANW was approaching a big level and all-time high (ATH) at $600. PANW ran up to this level, kissed it, and all of a sudden the tape showed a large number of sellers who caused PANW to head lower.
When PANW worked its way back up to $600, the tape showed there weren’t many sellers. This led us to think that we should keep holding PANW, since there is a good chance it would break through $600 due to the lack of sellers.
Once PANW breaks through $600, we want to see the buyers come in and hold PANW at $600.
By reading the tape, we were able to anticipate what might happen next. There was a seller with a large order size at $605, which became the new level PANW had to “deal with.”
This is the power behind the tape, showing how you can use it in trading to anticipate which key levels stocks will move toward or away from next.
PANW 10-minute Chart
If you’d like to watch how we traded PANW in the Simpler Trading Options Gold live-trading room, check out the video below for a real-time visualization of how we read the tape to lock in over 100% return on investment.
How to Read the Tape:
On the Time and Sales tab, the size represents the amount of shares.
However, on Level 2 we need to do a bit of basic math. Whatever the size is, you must multiply that by 100 to get the actual number of shares traded.
For example, if on Level 2 a seller offers a size of 2… We would multiply 2 by 100 and know that the seller offered 200 shares.
If the price was at $615, we would multiply 200 shares by $615. This means that a seller is offering $123,000 for their PANW stock. If and when PANW gets to $615 and the seller is still around, there needs to be enough buyers that want to accumulate $123,000 worth of this stock to get through that key level.
That is why tape is so important.
If you’d like an even deeper dive into reading the tape and how to apply it to my go-to strategy for quick profits daily, check out my 4-hour Options Scalping Secrets course here. I explain my strategy for identifying key levels using my simple indicators to catch big scalping moves daily.
As we jump into the week ahead, we want to share our focused list of good looking trends and bullish structure in the market.
Many names aren’t showing clean setups…
To name a few, the S&P 500 (/ES), Nasdaq (/NQ), and Russell (/RTY) aren’t showing clear trend, structure, or momentum. The technology and semiconductor sectors also lack our “big 3” criteria.
Instead we want to shift our focus toward sectors that are in a clean uptrend.
In the video above, we’ll review sectors like energy, agriculture, and healthcare that match our bullish checklist. These sectors have established uptrends, bullish structure, and are backed by momentum.
Another month has come to an end. As we head into April, we want to make sure we’re all focusing on the best trends and setups possible.
In the Compounding Growth Mastery, we keep an updated watchlist of setups that fit our “Big 3” criteria – trend, structure, and momentum. To give you a head start for the month ahead, here’s a part of our current watchlist below.
XLE (EOG, DVN, FANG, CVX)
USO, UNG
GLD, FNV
MO
LMT
ATI
MOS
AA
CCJ
NVDA
COST
Notice a common theme throughout these setups?
All have the same “big 3” criteria. When we’re looking for setups to play to the upside, here are a few of our requirements (which each of these tickers meet):
Trading above the weekly 21 exponential moving average (EMA)
Positively stacked EMAs on the weekly and daily charts
Buy signals
Squeeze across multiple time frames
Keep in mind, we’re always aiming to take entries at the daily 21 EMA on these setups. At the moment, a handful of names are setting up nicely at the 21 EMA. The rest will have to pull back in order to present an entry.
We hope you find this list helpful! We’ll be covering all of these setups (and more) in this Sunday’s newsletter video.
In the meantime, take a look at charts for the stock list above, and see if there’s anything from the list you want to keep an eye on next week.
Friday marks the last day before the start of a new month and quarter in the market. This is very important for Wall Street, as we’ve discussed the rebalancing and rotation happening at the end of the quarter.
After a monster push, the market is seeing red days to end the month. The conversation now focuses on… Is the market extended?
Technically, yes, but that doesn’t necessarily mean the market will continue to head lower.
The market is starting to trend down, as the S&P 500 (/ES) broke below $4,586 and is now heading toward the next key zone at $4,554.
Pay attention to how “big money” reacts. Will these players continue to sell things off in the new quarter or start pushing the market back up again?
Be mindful of volatility, rotation, and distribution that could happen at the start of a new quarter.
In the video above, we’ll walk through the technicals on our charts, create a road map for Q2, and lay out setups on PANW and TSLA.
The market is continuing to explode above the Ichimoku Cloud. Let’s discuss what matters in extreme volatility and review our focused list for the week.
There are multiple monthly calendar events to review as we wrap up the end of the month and the first quarter. We have the ADP Employment report on Wednesday morning, followed by the Nonfarm Payroll job report on Friday morning. Both of these job reports could be catalysts that move what we call the “mamba” market.
And, the S&P 500 (/ES) finally ripped through the daily Ichimoku Cloud.
As long as the market is above the daily Cloud, we want to play this market to the upside. The /ES is back above all key moving averages, pushed out of the daily and weekly Ichimoku Cloud points, and retreated to the weekly mean.
Until the /ES arrives at our next major key range from $4,586 to $4,600, anything is possible. The market could completely roll over and revert or keep pushing higher, so be sure to avoid having a strong bias one way or another.
Here is our focused list:
SNOW — Expect price to move sideways or higher based on rebalancing and funds driving SNOW up to liquidity levels. SNOW is printing a 4-hour squeeze, so look for dip buys. We’ll watch for it to fill the gap from $240 to $250.
SHOP — Has shot higher due to rebalancing toward liquidity. Look for a bounce off the range from the Friday low at $666 and the daily mean at $675 up to point of control (POC) at $703.
It’s back to the basics. We’re focusing on the “best” trends the market has to offer.
At the moment, the sectors showing trend, structure, and momentum are the energy sector (XLE), healthcare sector (XLV), and fertilizer stocks.
We’re seeing buy signals, positively stacked exponential moving averages (EMAs), and green 10x bars across the board.
Now, the only thing missing for an ideal entry is a pullback to the daily 21 EMA.
In today’s watchlist video, we’ll discuss our favorite setups in each of these sectors along with where we’d like to set chart alerts to enter positions this week.
Another wild week is in the books for the markets. The indexes and leading names continued their grind higher in what has been one of the “crazier” short squeezes we’ve seen in a while.
Next week we have quarterly-expiration in the options market on March 31, which likely means the market could trade sideways into Friday. While we patiently wait for more clarity in the indexes, we’ll be focusing on the best trends the markets have to offer and taking good entries as they’re offered.
What are the “best of the best” trends in the market at the moment?
Based on our criteria, energy stocks, healthcare stocks, and fertilizer stocks all have the attractive combination of trend, structure, and bullish momentum. As good as these trends look, it’s important to not chase an entry.
A dip and a better entry is always around the corner, and that better entry is always worth the wait.
Below are a handful of our favorite setups in these leading sectors:
XLE: Energy Sector
EOG
DVN
UNG
EOG Daily Chart
DVN Daily Chart
XLV: Healthcare Sector
JNJ
CVS
CVS Daily Chart
Fertilizer stocks:
MOS
CLF
MOS Daily Chart
Notice a theme here?
These setups are all in uptrends, have positive histograms, and positively stacked exponential moving average (EMA) points. When a setup fits this criteria, our only job is to wait for a dip and take action when the ideal entry is offered.
We’re going into the weekend holding positions in DVN, CVS, and a few others that we’ll be covering in the Sunday watchlist video. For the stocks and sectors that don’t have these bullish criteria, we’ll ignore those until they begin to rebuild their charts.
The market is at key inflection points which means plenty of opportunity for us traders. Once price reaches major support or resistance levels, anything is possible.
We must avoid having any major bias in one direction or another.
We’re continuing our conversation on the daily Ichimoku Cloud now that the S&P 500 (/ES) is trading near the flat line level at $4,510. This will be the Cloud top level for the rest of the month, with another flat line level to follow in April.
This is a critical zone for the overall market:
Now that the /ES broke through this range, we could see a push to $4,600 at the top of key ranges.
The /ES could also fail, retreat to the Cloud top, and roll over.
While the /ES consolidates through these key levels, we are also watching the 4-hour squeeze develop. This is starting to give the market structure. As the squeeze gets tighter and tighter, it could eventually either pop out of the Ichimoku Cloud or hit resistance and reverse.
The market could continue to be range-bound, so play off the key levels, watch the squeeze develop, and be ready for when the next big move occurs.
In the video above, we’ll define the key levels on the major indexes and discuss our two favorite setups on PANQ, the cyber security stock, and TSLA now that it is breaking through huge zones.