Preparation Process
Prepping for the trading session is vital for becoming a successful trader and should become a daily, systematic practice. The goal of prep is to identify stocks with the best setups and opportunities. Once we identify these stocks, we can ignore everything else for the trading session.
Day Trading Prep – by Chandler Horton
For day trading, I recommend only watching a handful of stocks and getting to know how they move and the risk vs. reward they offer. Every stock can present opportunities, so find your favorites and ignore all else for the most part.
Don’t underestimate the power of focus. The trader who chases too many stocks capitalizes on none. You will never catch every move, so make sure you have a reason to be watching a stock!
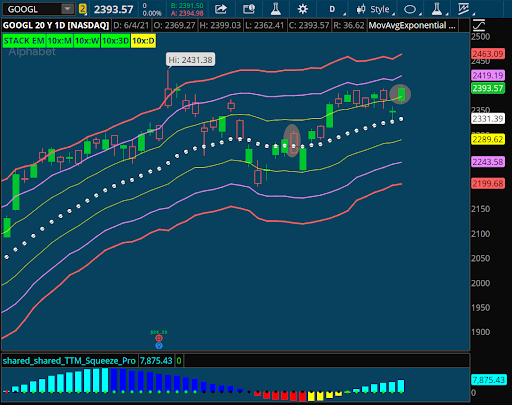
New names come and go, but make sure you hit the best trades on your focus list! My “ole reliables” are SPX, GOOGL, ROKU, MRNA, and NVDA. Every session, these names offer opportunities, so there’s no need to look much further!
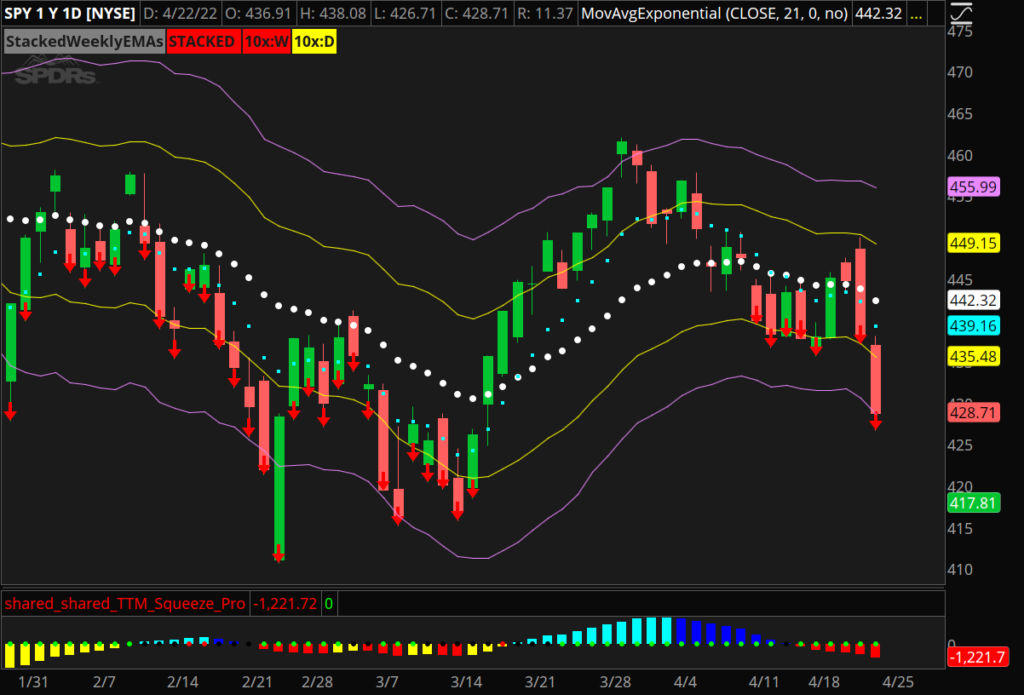
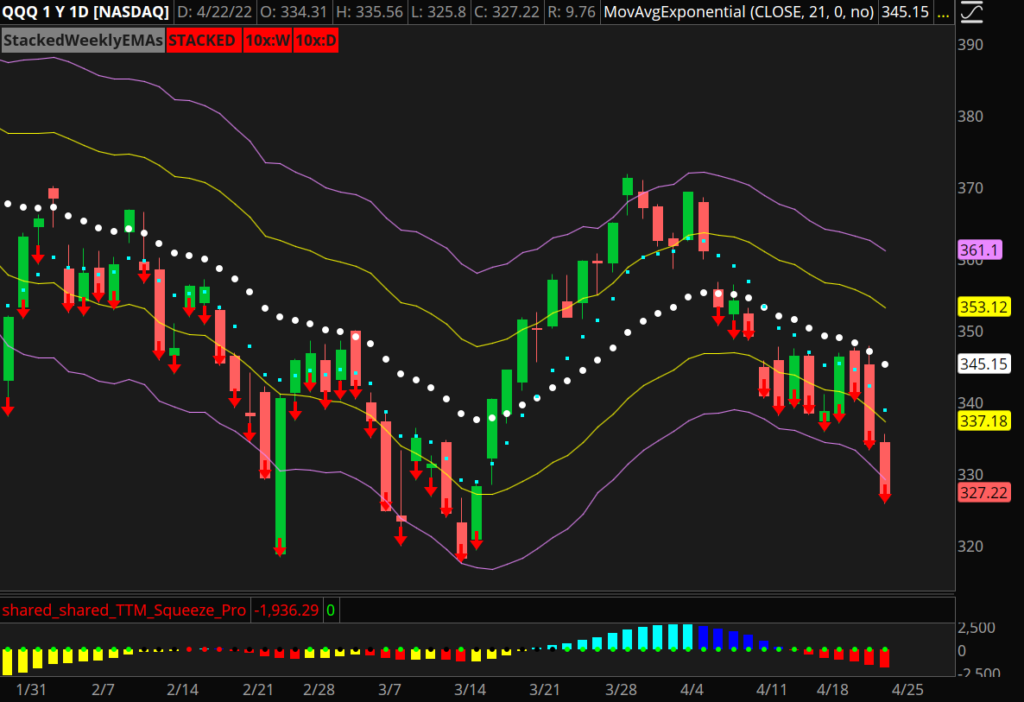
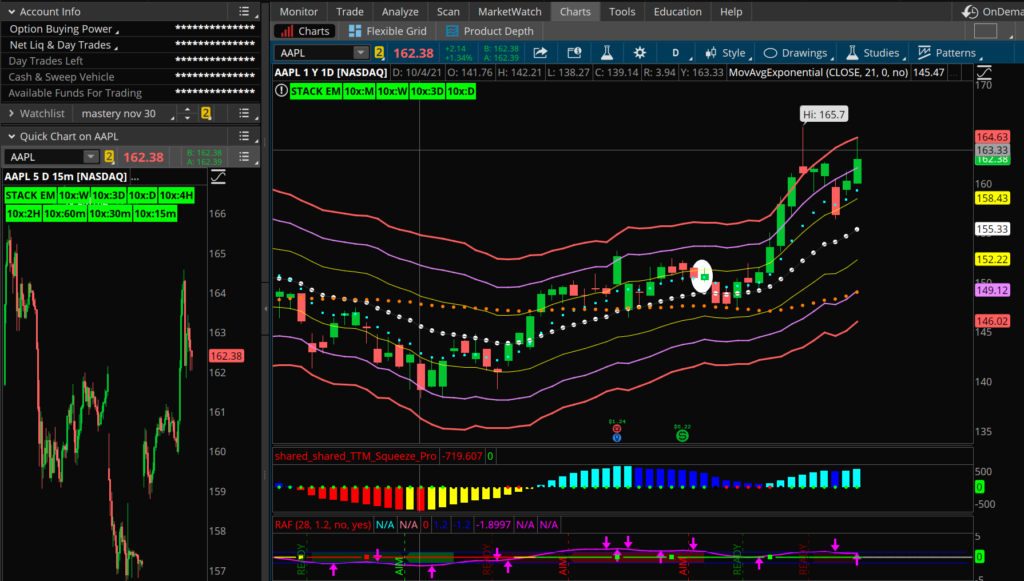
Always start with the big picture for a stock. Understand that not every stock is in a playable range. This is why we have a focus list. As you go through each name, you will find which stock is in a tradable range that offers the best edge! Keep in mind some names need time to set up.
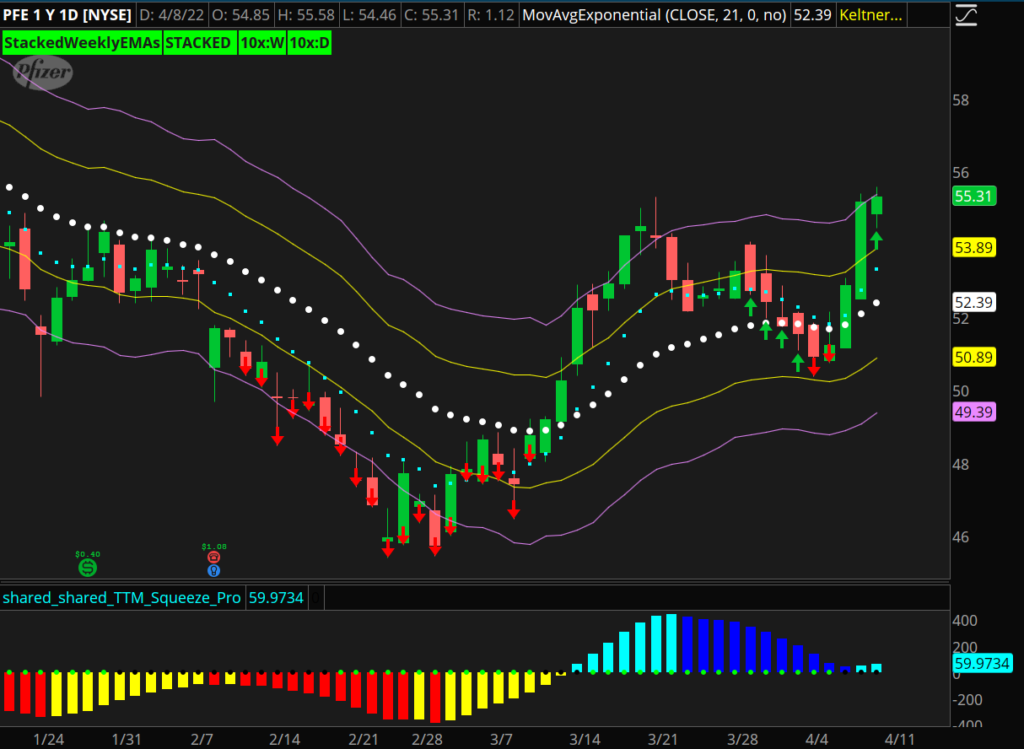
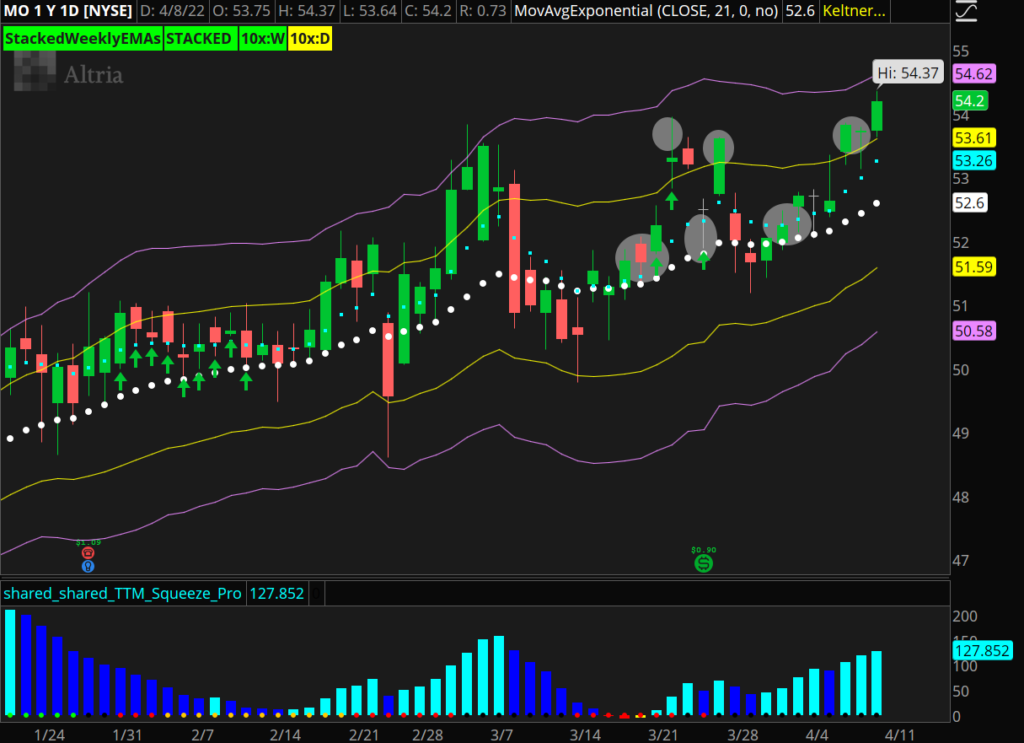
We like to narrow down names near big inflection points and key indicators. This is where strategy is a benefit.
Some stocks have already made big moves and need a pullback.
Some stocks are setting up and about to begin week-long moves.
Swing Trading Prep – by Taylor Horton
When I first started trading options, I wasn’t using a scanner. Now it is a part of my daily prep process. Before, I would stay up all night searching through charts that had what I believed was a decent setup. Decent doesn’t cut it.
We have this built-in mindset to grind and look for setups all night. In reality, what we want to look for is efficiency. Using a tool to sift through charts for the best setups eliminates emotions and saves time.
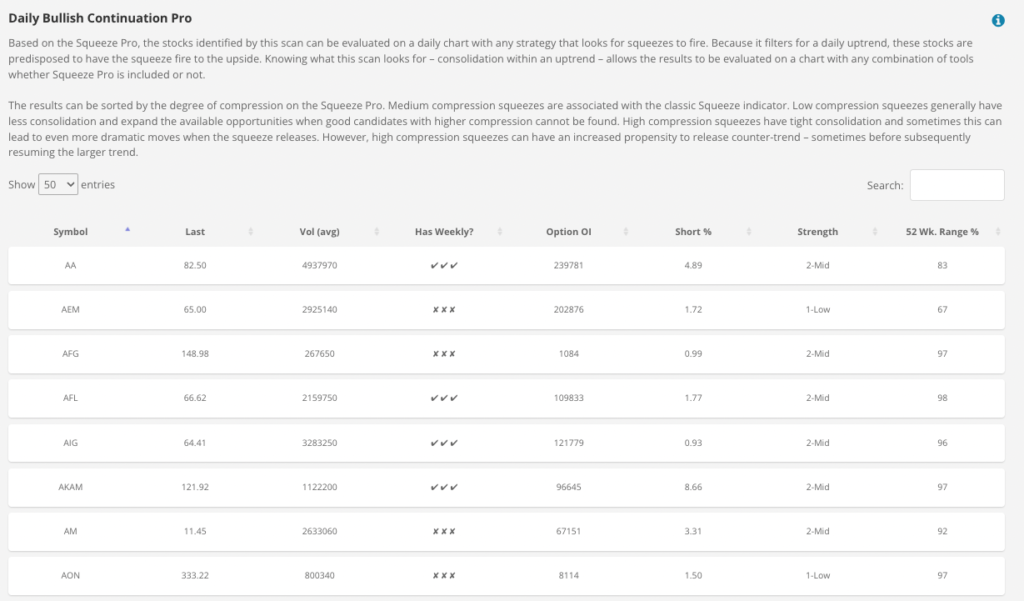
Above is a list of the scan results from the Simpler Trading scanner. This is your starting point.
70% of the time, I use results from the Focused Scans.
These are scans designed for my strategy. We have four scans under our Focused Scans: the Bullish Daily Continuation Pro, Bearish Daily Continuation Pro, 3-Day Daily Bullish Continuation Pro, and 3-Day Daily Bearish Continuation Pro.
The rest of the time, I use results from scans like the Growth 250, 10x scans, Daily Pop Candidate, and others included in the Scanner.
I prefer to trade mid to large-cap (capitalization) stocks. To focus on those stocks, I like to sort by Volume (average), with names with the most volume at the top (as shown below).
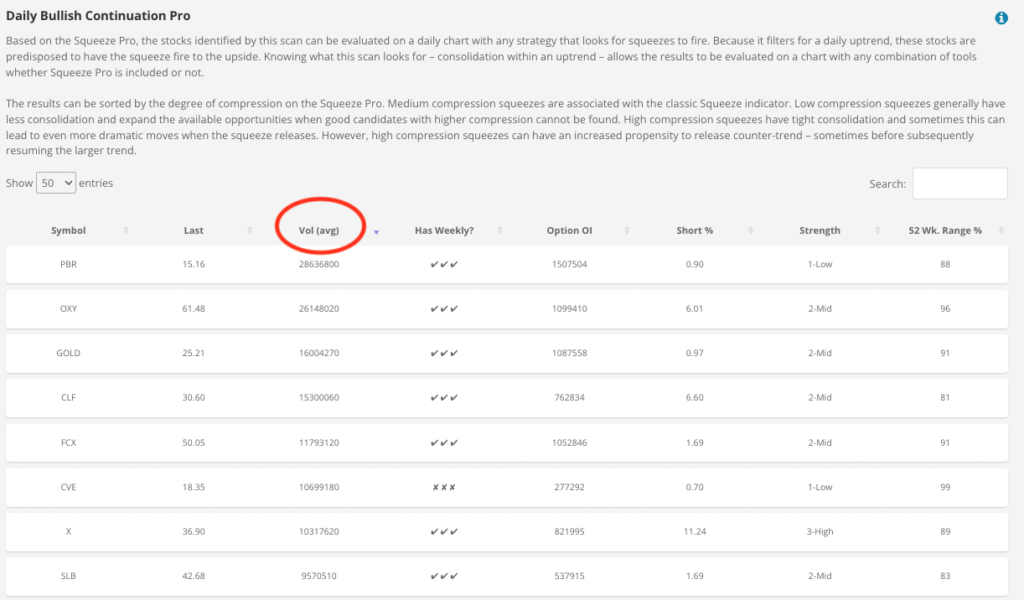
When there is more volume, the stock is larger. It has more momentum, and more importantly for an options trader, there is higher liquidity.
I like to show about 50 entries. You can choose to have 10, 25, 50, or 100 entries showing in a list at once. That’s 100 stocks you can automatically sift through in just seconds.
After I run the scans, I will look at each scan’s top 25 to 50 results. The next step in our prep process is running the names through our checklist criteria. This is when we determine which setups “fit the bill” and have actionable opportunities.
This is when you need to have discipline and a trading plan. Remember, the setups that don’t meet every one of our criteria get ignored entirely because they are none of our business.
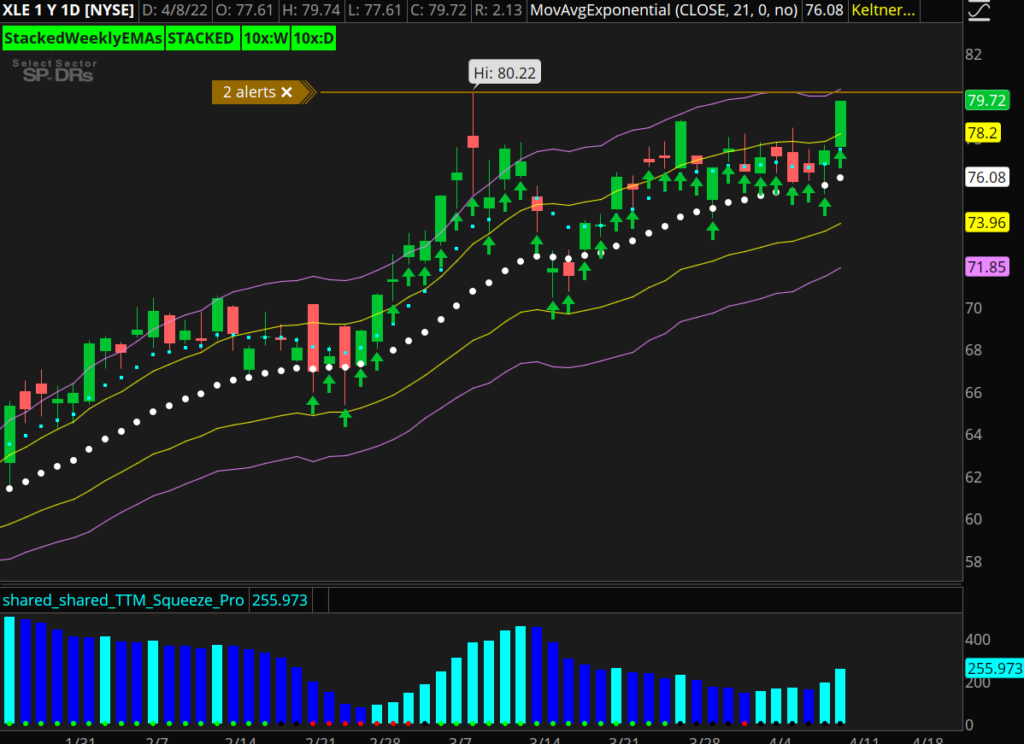
Taylor’s Focused List
Here is a list of my focused list for Friday, April 22, 2022:
- CCJ
- OXY
- XLE
- KR
- COST
- IYT
- XLF
Prep with Us
Our job as traders is to know when and why to trade each name! Tune in to the Focused Trades Youtube Channel every Monday, Wednesday, and Friday for live premarket prep with us.
Take your prep to the next level and check out Chandler’s Options Scalping Secrets course here. I explain my strategy for identifying inflection points using simple indicators to catch big scalping moves daily.
Stay Focused!