focused-trades-logo-w-taylor
focused-trades-logo-MOBILE

Big Structure in Focus


After a short week last week, our focus is on structure. 

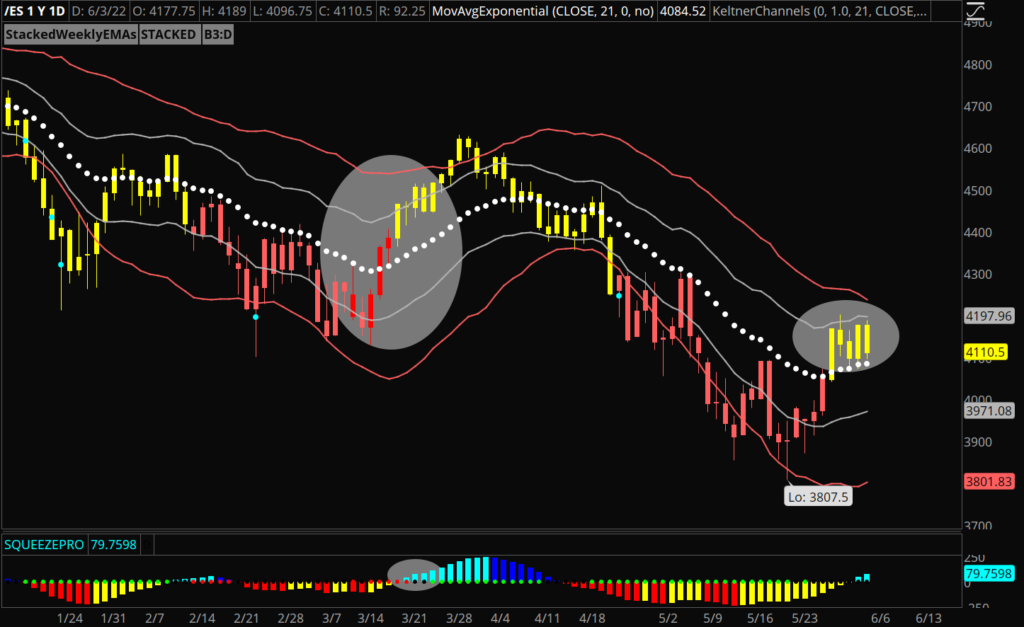
The S&P 500 (/ES) is trading below its trendline structure, which leads us to lean more bearish. On Monday, the /ES gapped up and failed to key levels.

The major catalyst this week is the Consumer Price Index (CPI) report released on Friday. We’ll follow up in the Thursday newsletter to hone in on how this inflation report can affect price action.

We’re also watching two specific events on SHOP and AMD.

On Tuesday, the SHOP 10:1 stock split voting will occur. On Wednesday, AMD has a financial analyst day, which could impact price.

In the video above, we’ll review the new liquidity levels on /ES, lay out key zones and structures, and walk through our favorite setups that we’re keeping an eye on.


Here is our focused list:

SHOP — There is a large flag forming. Be patient for the stock split news as this will be a large catalyst, up or down. If SHOP works its way up to $383 and the daily 21 EMA, this could be a short opportunity. If SHOP moves through $383, we can look for it to move to the trendline structure. The same goes for the downside. If SHOP breaks $383 and moves lower, we can look for it to break to the trendline and either pop back or drop lower.

AMZN — This is the first week since the 20:1 stock split. Practice patience and observe the options premium. AMZN has a big gap to fill from $130 to $140. If AMZN continues to fail at its key zone and reverses, we’ll look for a short to the $121 range with the daily mean near $118.

AAPL — If AAPL pops toward $148 and above the daily mean, we could look to short it. Note that POC is at $145.44. If AAPL fails and drops, see if it breaks structure and heads toward the $140 range. If AAPL holds POC, AAPL could pop to $152 to $154.

Stay Focused!


Bearish Structure, Bulls Taking Over?


Options traders must be aware of quarterly expiration on Thursday, June 30th. There are similar structures on the S&P 500 (SPX) between this week’s structure and the structure in March 2022 (the previous quarterly expiration).

We’ll observe the short-term and long-term structure and price movement we could expect heading into the rest of the year.

In the video above, we’ll lay out potential plays on SPX and review names on our watchlist including XLE, XOM, CHK, and more.

Stay Focused!


Bring the Chop?


As options traders, there are certain expiration dates we want to be mindful of. Bigger than them all are quarterly expirations.

The next quarterly expiration series is on Thursday, June 30th. We’re seeing similarities between the current market and the structure in March 2022 (the previous quarterly expiration).

 The overall structure of the market remains bearish. We don’t see that changing anytime soon. 

What we’re discussing here is “short-term thinking”. 

Looking at the chart of the SPY futures below, you’ll notice a similar pattern to what we saw back in March:

  • Consecutive closes above the daily 21 exponential moving average (EMA)
  • Positive shift of the histogram
  • Big 3 Bars going red to the yellow


/ES Daily Chart


This doesn’t mean the market is suddenly bullish. Nor does it mean the market doesn’t roll over from here. This potentially suggests the market is positioned to crush shorts into quarterly expiration, just like it did in March. If this is the outcome, we’ll have a 2- to 3-week window to take advantage of the “put destruction” by pursuing long positions or credit spreads on SPX.

If we see a close back under the daily 21 EMA, the chances of any short squeeze from here are slim.

Another suggestion: Consider opening a few deep out-of-the-money (OTM) iron condors. This week, we sold an iron condor on SPX for the quarterly expiration. We sold calls and puts 9% above/below the current price. These iron condors make for great “income-producing” trades while we wait for clarity regarding the next directional move. 

Stay Focused!


Nonfarm Payroll Pre-Market


The final catalyst for the week is the Nonfarm Payroll (NFP) job report set to report pre-market on Friday.

The market worked its way back to the daily mean at the 21 exponential moving average (EMA) and rallied to the high of the week on Thursday.

If the S&P 500 (/ES) breaks above the trendline near $4,212 to $4,220, look for it to reach the 50-day simple moving average (SMA) and $4300.

Follow the market and target structure. In the video above, we’ll review the price action of the major indexes and volatility and review setups on NVDA, SHOP, and APPL.

Stay Focused!


Bulls Back?


The shortened holiday week ahead means less time to take advantage of setups and cheaper premium for options. Now that we are almost through earnings season, we have a regular and volatile week ahead with a few upcoming catalysts.

On Wednesday afternoon, the Federal Reserve will release the Beige Book. For the rest of the week, it’s all about jobs.

On Thursday morning, we’re going to have the ADP Employment report. On Friday morning before the bell, we have the Nonfarm Payroll (NFP) report released. These are both two catalysts to keep an eye on this week.

In the video above, we’ll cover the major indices after a strong close on Friday and review setups on our watchlist.


Here is our focused list:

NVDA — If NVDA pulls back to the daily mean and finds support, it could break through $189 to the $195 to $200 range. If it breaks below the daily mean, there might be chop or selling pressure to $170.

SHOP — This has been a weak name that hasn’t reverted to the daily mean often. See if SHOP could work its way back toward its 21 exponential moving average (EMA) and revert to the mean to $400. After this, we could see a push to $450 and $470. Until SHOP is back above $413, it is in a vulnerable range. To the downside, we could see SHOP rollover to the $300 range.

Stay Focused!


Short Squeeze Structure


The market will be closed on Monday, May 30th, for Memorial day weekend. We hope you can spend time with family and friends and take a well-deserved break from the market.

The S&P 500 closed above the daily 21 exponential moving average (EMA) on Friday for the first time since March. However, this doesn’t change the bigger picture that the path of least resistance seems to be to the downside. 

That being said, we’ll look for bounces to be our next short opportunity.

In the video above, we’ll lay out how to play these ebbs and flows with short positions and review our SPY call debit spread.

Stay Focused!


SPY: $420 or Bust


For the last few weeks we’ve been discussing the potential of a short squeeze in the markets. That’s exactly what we saw on Thursday and Friday of the 3-day weekend. 

Bear market bounces are fast, brutal, and can last longer than anyone who’s holding short positions would like to bear (no pun intended). The key, however, is to see these bounces for what they are. So long as the weekly structure remains bearish, these bounces can make for some of the best shorting opportunities in a downtrend. 


SPY Daily Chart


Looking at the SPY, it looks like it could have cleared itself a path for a push into $420 next week with Friday’s close above the daily 21 exponential moving average (EMA). While our major focus will be shorting this bounce, remember that these reversion-to-the-mean moves can make for solid, albeit short-lived, long positions. 

On Friday afternoon, we bought a 6/03 expiration call debit spread on the SPY in the Compounding Growth Mastery. Should we get the push into $420+, the trade should net a 200% to 300% return. We’ll look to parlay those profits into new shorts.

As for structuring shorts, we’ll be looking for initial entries in July expiration call credit spreads with a simple risk management plan. So long as the market is trading under the weekly 21 EMA, we’ll continue scaling into shorts looking for the next flush to new lows. 

The overall market might be as bearish as it’s been in a while, but there continues to be great setups looking poised for more upside. XLE, USO, and XEL are just a few examples we’ll cover in this Sunday’s watchlist video!

Stay Focused!


Reversion to Mean, Short Week Ahead


Now that the market has digested the FOMC minutes and NVDA earnings, we’re ready to take on whatever the market brings next on Friday.

In this video, we’ll break down the S&P 500 (/ES) daily chart to show similar patterns over the last two days. This gives us more clarity and confidence moving forward.

We’ve seen the market hit a key level, flush below it, and make a strong recovery for a reversion to the mean. This is an important lesson of how price acts at large key levels.

After a big flush to $3,855, we saw /ES seek out liquidity in a cover pop type fashion. What we mean by liquidity is price working toward point of control (POC) and the daily mean (21 exponential moving average).

Regardless if we’re bullish or bearish, this is the area we want to step back, reanalyze, and prepare for what can happen next.

We’ll review the major indices and cover a few setups on our focused list on NVDA and SHOP.

Stay Focused!


Fresh Week: NVDA Earnings, FOMC Minutes


After a choppy week of options expiration (OPEX) this week, a few catalysts are to note. 

Federal Reserve Chairman Jerome Powell is giving welcoming remarks on Tuesday afternoon. This pre-recorded event will likely not be a significant market mover, but it is worth keeping an eye on.

More importantly, the Federal Open Market Committee (FOMC) minutes will be released on Wednesday. This is a chance for the algorithm to react to the minutes without having Powell speak afterward.

We’re focusing on two names recording earnings this week. Both NVDA and SNOW will report earnings on Wednesday night.

As for the overall market, we’re focusing on similar key zones.

As long as the S&P 500 (/ES) is above $3,855 (the low from two weeks ago), the market could work its way back toward liquidity. Point of control (POC) is near $4,013, and the daily mean (21 EMA) is above near $4,070.

If /ES breaks below $3,855, the market will become extremely vulnerable. We’ll look for it to drop to last week’s low at $3,807.50 and potentially hit $3,796 and $3,760.

In the video above, we’ll discuss the key zones on the major indexes and share charts with our favorite setups.

Here is our focused list:

NVDA — Be patient heading into earnings. See if it can work its way back to liquidity at POC near $174. We’ll look to trade NVDA off the low at $156.

SHOP — There are three main levels of liquidity that we are eyeing: the current POC at $360, a prior POC at $340, and another prior POC at $401. We’re planning on buying SHOP and playing it back up to the range from $383 to $400 before it potentially reverses.

ROKU — With any dips, look to play ROKU up to POC and the daily mean near $96. Above this, we’ll look for $103 to $106.

Stay Focused!


SPX Squeeze Fires Short


The S&P 500 (SPX) put in a new low at $3,810 and bounced into the close on Friday. Now the question becomes if we can get a bounce to the 21 exponential moving average (EMA). 

The SPX is trading below the weekly 21 EMA for the first time since COVID-19 started. This represents a large shift in trend and structure. 

If we consider the bearish squeeze firing, we have even more reason to believe the path of least resistance could be to the downside.

In the video above, we’ll lay out where we’d like to short SPX along with other setups on our focused list like AAPL, TXN, and more.

Stay Focused!