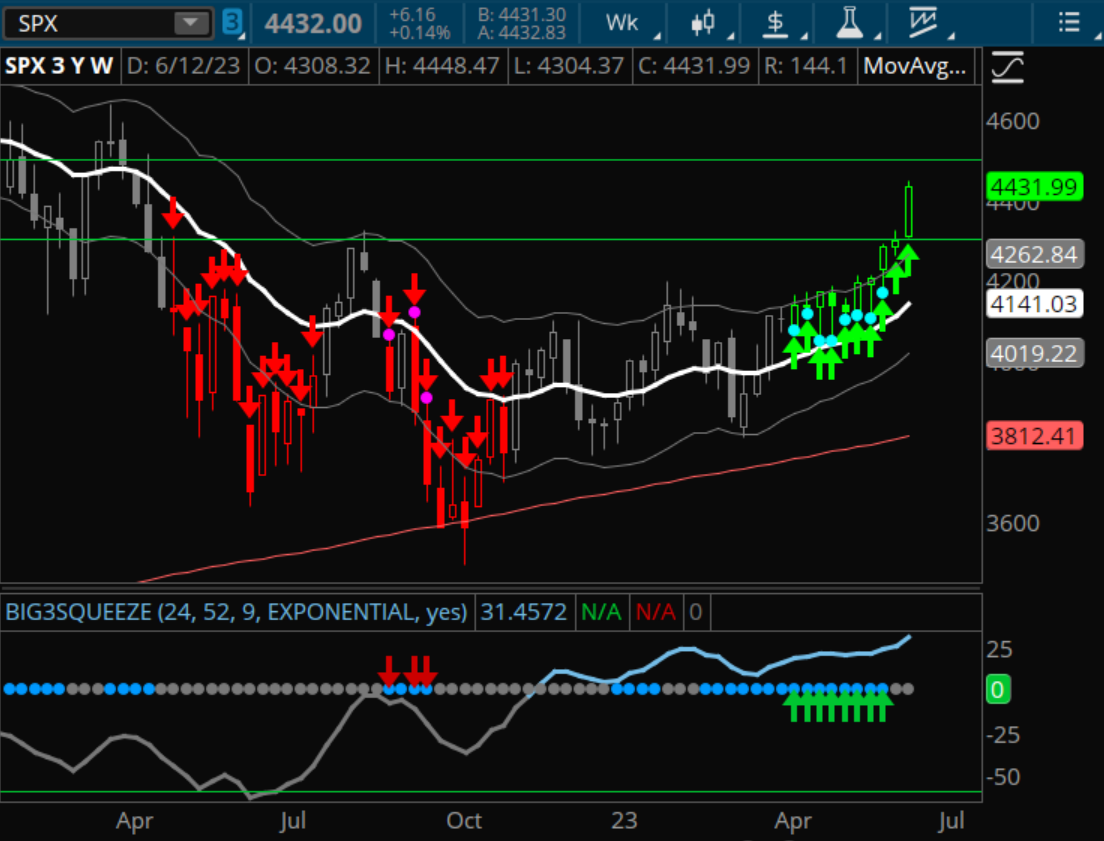
focused-trades-logo-w-taylor
focused-trades-logo-MOBILE

Insane Recovery After CPI


Wow, what a day. Thursday had insane price action with a huge gap down after the Consumer Price Index (CPI) reported, a stop at a major zone, and a monster reversal up.

It’s all about economic data this week, and Thursday’s price action is proof of why we want to pay attention to the economic calendar. The CPI report woke up the market and dropped it heavily before the major pop.

On Friday, Retail sales will report before the market opens. News accelerates technicals, so be wary of how the results impact the market.

The biggest thing that was our focus this week was the low of the year at $3,571. We laid out targets below at $3,541 and $3,506.

After the CPI numbers were released, price hit our major zones below, broke back through the low of the year, through the CPI candles and liquidity zone, and hit the $3,700 range we’ve been discussing.

In the video above, we’ll lay out key liquidity levels and zones to watch on /ES and the Volatility Index (VIX).

Learn how I find new SPX trades 5 days a week using my scalping strategy. Watch the replay of my free webinar on Wednesday, October 13th here.

Stay Focused!


Closing Toward The Lows


There are major economic reports being released this week.

On Wednesday we have the Producer Price Index (PPI) at 8:30 a.m. Eastern following the Federal Open Market Committee (FOMC) minutes at 2:00 p.m. Eastern. To end the week, we have the Consumer Price Index (CPI) on Thursday and the Retail Sales report on Friday, both at 8:30 a.m. Eastern.

After rallying on Friday, the S&P 500 (/ES) sat at $3,792, its point of control (POC). /ES then broke a major structure to the downside, breaking last month’s POC at $3,669. The major index ended the week at $3,639.

This week, see if /ES can hold $3,639 and pop toward structure around $3,700. If /ES continues higher from there, my next target is the previous gap-fill target of $3,735. If /ES breaks $3,639 and heads lower, my first target is $3,613. My second target is the low of the year at $3,571.

For a bigger picture thesis, if /ES can’t hold the low of the year at $3,571, my major downside target is the pre-COVID-19 high of $3,397.

Last month’s thesis that the Volatility Index (VIX) would approach $35 unfolded perfectly with the market. As the market goes lower, VIX will move higher toward $35 again. If VIX guides lower and causes the market to pop, it could break $26 and make its way to $25.

AAPL continues to be our compass for the market. See if AAPL breaks structure around $140 and moves toward $137. Similar to the market, I have a major downside target of $129, the low of year. If AAPL holds structure around $140, see if it can pop toward $146 and head to $149, the daily 21 exponential moving average (EMA).

My main focus for this week is SPX. Watch the video above to see which key levels and structure I’m noting on /ES.

Learn how I find new SPX trades 5 days a week using my scalping strategy. Register for my free webinar on Wednesday, October 13th at 7pm CST here.

Stay Focused!


Pressure on The Market


The S&P 500 (SPX) short squeezed into Thursday. SPX never reached above the 21 exponential moving average (EMA) and continues to show a daily Big 3 sell signal. With no true confirmation for an entry, the best thing we did this week was to stay patient and not get caught up in the short squeeze. 

Keep in mind that SPX is showing its first daily negative Squeeze Pro histogram since 2008. Now that SPX is showing bearish momentum and under the 21 exponential moving average (EMA), it could indicate that our uptrend from this year is near an end. 

With SPX gapping down on Friday, this leaves us heading into the weekend with the path of least resistance to the downside. Let’s take a look at the most important pieces of the puzzle heading into next week.

In the video above, we’ll review SPX and the pieces that are coming together to show that the change in trend is near. We’ll also review our put credit spread UNG position from this week and the call credit spread in AAPL for November expiration in my Compounding Growth Mastery.

Stay Focused!


Market Coiling Near Liquidity


There is one highly-anticipated report leading us into the end of the week, Non-Farm payroll on Friday at 8:20 a.m. Eastern. Also, keep in mind the Federal Open Market Committee (FOMC) minutes will be released next Wednesday, October 12th.

Monday’s newsletter unfolded perfectly with the S&P 500 (/ES) recovering the low of the year at $3,571 and pushing toward the gap fill from $3,735 to $3,763. /ES rallied through point of control (POC) at $3,792, hit the 21 exponential moving average (EMA) at $3,818, and is consolidating into the end of the week.

The /ES Point of control (POC) moved from $3,669 to $3,792 in the new month of October. This level is important as that is where the most liquidity is and the most buyers and sellers are. 

If /ES can’t hold $3,751 my first target is the structure around $3,720. My second target is last month’s point of control (POC) at $3,669. If /ES continues to hold $3,763 see if it can get through the 21 exponential moving average (EMA) at $3,818 and hit my main upside target at $3,875.

My main focus to end the week continues to be SPX. Watch the video above to see which key levels and structure I’m noting on /ES.

Tune in to trade SPX and other potential opportunities in the market with me live in the Simpler Day Trading room, try a one-week trial!

Stay Focused!


Market In Danger: Breaking Lows


We have a volatile final quarter of the year ahead of us. This week’s two reports in focus are the ADP employment report on Wednesday at 8:15 a.m. Eastern and the Non-Farm payroll on Friday at 8:20 a.m. Eastern. 

Last week ended red with the S&P 500 (/ES) struggling to hold structure around $3,700 and breaking major levels to the downside. /ES dropped through its previous low of the year at $3,639 and closed at a new low at $3,613. Overnight, /ES created a small gap toward $3,587 putting in an even lower low.

Pay attention to the previous low of the year at $3,639 and the trendline structure we created above. Be cautious overall for upside opportunities; however, if /ES can hold $3,613 and head higher, see if it can break $3,639. From there, my upside target is the gap fill from $3,735 to $3,763.

For the downside, see if we reject the trendline structure and break $3,613. From there, my first target is $3,541. My second target is $3,500. Be mindful that if /ES does not pop, we could dive to those levels quickly. Try not to chase and instead, look for pops for potential short opportunities.

The Nasdaq-100 (/NQ) struggled with its levels last week and broke its previous low of the year at $11,068. It put in a new low of year near $10,979. See if /NQ can retest $11,068. If so, my first target is $10,942 and my second target is at $10,813. See if /NQ will guide the overall market lower.

My main focus to end the week continues to be SPX. Watch the video above to see which key levels and structure I’m noting on /ES.

Tune in to trade SPX and other potential opportunities in the market with me live in the Simpler Day Trading room, try a one-week trial!


Stay Focused!


Can Bulls Hold Support?


Can the bulls save the market in a vital spot?

In order for structure to flip bullish, the bulls will need to hold support here.

While structure remains bearish, stay open-minded as the market could easily switch directions. We want to remain neutral and catch the rip if the S&P 500 (SPY) does rally back to $390.

While the market is oversold, it isn’t enough to justify a rally. The market is considered oversold because it is trading over 2 average true range (ATR) moves below the 21 exponential moving average (EMA).


In the video above, we’ll review both perspectives: the path of least resistance to the downside and the potential short-term bullish structure change. We’ll take a look at our SNOW put debit spread opened in the Compounding Growth Mastery on Monday.

We’ll also identify areas to observe this week to see if there’s a greater likelihood for the market to flip bullish, including moving average crossovers as we’ve discussed recently.

Stay Focused!


Recipe For Double Bottom


The market is in a waiting game, as traders anticipate which direction the market will move next.

The market is at a spot where it’ll need to fight hard to change its structure to bullish. For any sustainable rally for the market, we’ll need to see the items in our “Double Bottom Recipe” come together.


For the market to rally, we’ll need to see the Dollar (DXY) break down. However, the DXY is above the 21 exponential moving average (EMA) and isn’t at a spot where it will likely break farther down. There are Big 3 buy signals on the daily and 4-hour chart, signalling a bullish trend for DXY. We’ll need to see DXY start to pull back on a day-to-day basis. The S&P 500 and QQQ could start to move higher once the DXY begins to head lower.

Any bounce in the market will be short-lived unless HYG gets above previous support around $73. Its structure is still bearish with daily, 4-hour, and 2-hour Big 3 sell signals.

Any downside in AAPL or TSLA could drag the rest of the market lower, considering they make up such a large portion of the S&P 500 index and QQQ index.


In the video above, we’ll review the recipe for a double bottom in the market, specifically the S&P 500 and QQQ. We’ll use TSLA and AAPL as examples of whether the market can hold support or not. If these names break through support, there’s a large gap to reach the June lows below.

Want to trade my A+ setups together? Join the Compounding Growth Mastery where I send real-time trade alerts, deliver daily market updates, and host live trading sessions. Start out with a 30-day trial and see what it’s all about!

Stay Focused!


Major Levels Holding For Now


To end the week, we have the PCE Price index on Friday at 8:30 a.m. Eastern. Keep in mind rebalancing as we enter the final week of the third quarter.

As we discussed earlier this week, the S&P 500 (/ES) continued to hold the low of the year at $3,639. On Thursday, /ES closed near the gap fill from $3,735 to $3,763. With /ES above structure, see if it can rip through $3,763 and head toward our first target of $3,807. If /ES continues higher, our main target is point of control (POC) at $3,875.

If /ES holds $3,735 and fills the gap, my first target will be the structure below around $3,702. If /ES breaks below this structure, my next target is the previous low of the year at $3,639. My main downside target is the new low of the year at $3,613.

Pay attention to the Volatility Index (VIX) as it approaches a major resistance zone from $35 to $37.5. As /ES moves lower, VIX can provide additional confirmation for a short entry.

My main focus to end the week continues to be SPX. Watch the video above to see which key levels and structure I’m noting on /ES.

Tune in to trade SPX and other potential opportunities in the market with me live in the Simpler Day Trading room, try a one-week trial!

Stay Focused!


Major Levels Below, Gap Fill Above


Hey Focused family! I’m traveling back from Taylor’s wedding and unable to make a video, so I am providing my market prep below.


/ES 4-Hour Chart


On Friday, the S&P 500 (/ES) almost hit the low of the year at $3,639 and ended the week with a strong cover pop. Be mindful of potential rebalancing as we enter the final week of the third quarter. 

This week, Federal Reserve Chairman Jerome Powell is speaking on Tuesday at 7:30a.m. Eastern and Wednesday at 10:15a.m. Eastern. Powell is followed by jobless claims on Thursday and the PCE Price index on Friday, both at 8:30a.m. Eastern.

Pay attention to the short-term downside structure near the gap fill on /ES from $3,735 to $3,763.

If /ES can hold $3,639 my first target is to fill the gap from $3,735 to $3,763. If /ES breaks through $3,763 my second target is a reset to point of control (POC) at $3,875.

See if /ES fails at $3,763, as my next target will be the low of year at $3,639. If /ES continues lower my next target is $3,596.

Join me live in the Simpler Day Trading room and try a one-week trial. Tune in to trade even more of my setups, as well as look for more potential opportunities in the market.

Stay Focused!


Fear the Short Squeeze?


Should we fear the short squeeze?

There’s nothing a bear loves more than shorting a bounce that quickly leads to a reversal into new lows. For many (myself included), that is the game plan for swing trades in a downtrend: get short on the reversions to the mean.

While this is certainly a strategy that has merit, there’s always one thing the bears fear most looming in the distance: the short squeeze.

When the market reaches oversold readings and too many market participants are leaning short, the potential for a short-squeeze is always around the corner. In fact, you’ll see some of the biggest/rapid moves to the upside in a downtrend, all as a result of the market trapping shorts and squeezing them.

For those who have been short during a short squeeze, we know it can be an unpleasant experience. While it can be uncomfortable taking heat against our open positions, there’s a few adjustments you can make to put yourself (and your shorts) in a position to remain comfortable. 


Here are my tips for handling “the short squeeze heat”

  1. Get short into bounces, NOT when the market is deeply oversold. I look to get short near the daily 21 exponential moving average (EMA).
  2. Give your trades more time time till expiration. While short squeezes can be violent, they tend to be short-lived. Giving your trade more time till expiration will make it easier to sit through those rips.
  3. Sell call credit spreads. Selling out-of-the-money credit spreads with 30 to 60 days till expiration is a great way to get positioned for a bigger picture move lower, while still being able to sit through the ebbs and flows. So long as the market closes under your short strike at expiration, there’s a paycheck with your name on it.

So don’t fear the short squeeze! Instead, make adjustments that put you in a better position to stay confident in your trades during large bounces.

Trade with confidence during these short squeezes with Taylor’s daily market and trade alerts. Start a $7 trial today and start taking advantage of these large, volatile moves.

Stay Focused!