The bulls took the lead to start the week. Last week, I noted that the “bigger timeframes say buy-the-dip, while the lower timeframes say not yet”.
Despite the pullback last week, the higher timeframes remained bullish. The “issues” last week stemmed from the lower timeframes. Now that things are more aligned from the ground up, the key is to see how the bulls handle the first dip.
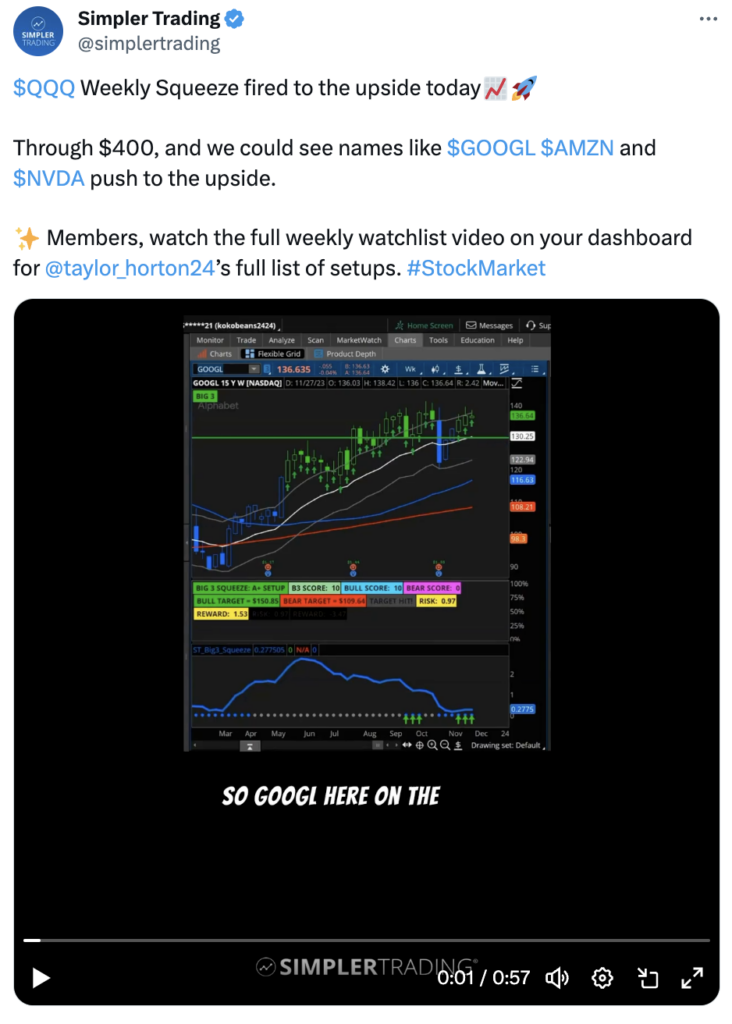
In the video below, we will review the structure of the market (SPX) and walk through the names on our watchlist including NVDA, GOOGL, TSLA, and more.
Our New Year’s Sale ends soon! Get 30% off the Big 3 Squeeze using the code: NEW24 at checkout. Get the Big 3 Squeeze System here.
Stay Focused,
Taylor Horton