The S&P 500 (SPX) finally hit $5,000, officially making a new all-time high. The question is, where do we go next? With most of the market being above the 21 exponential moving average (EMA), it does suggest that we could be close to the end of the move rather than the beginning. However, the monthly squeeze on SPX has fired towards the upside recently so this strength could continue into next week.
Follow me on X, where I post what my Big 3 Squeeze signals are showing me. Check out my latest post on the IWM:
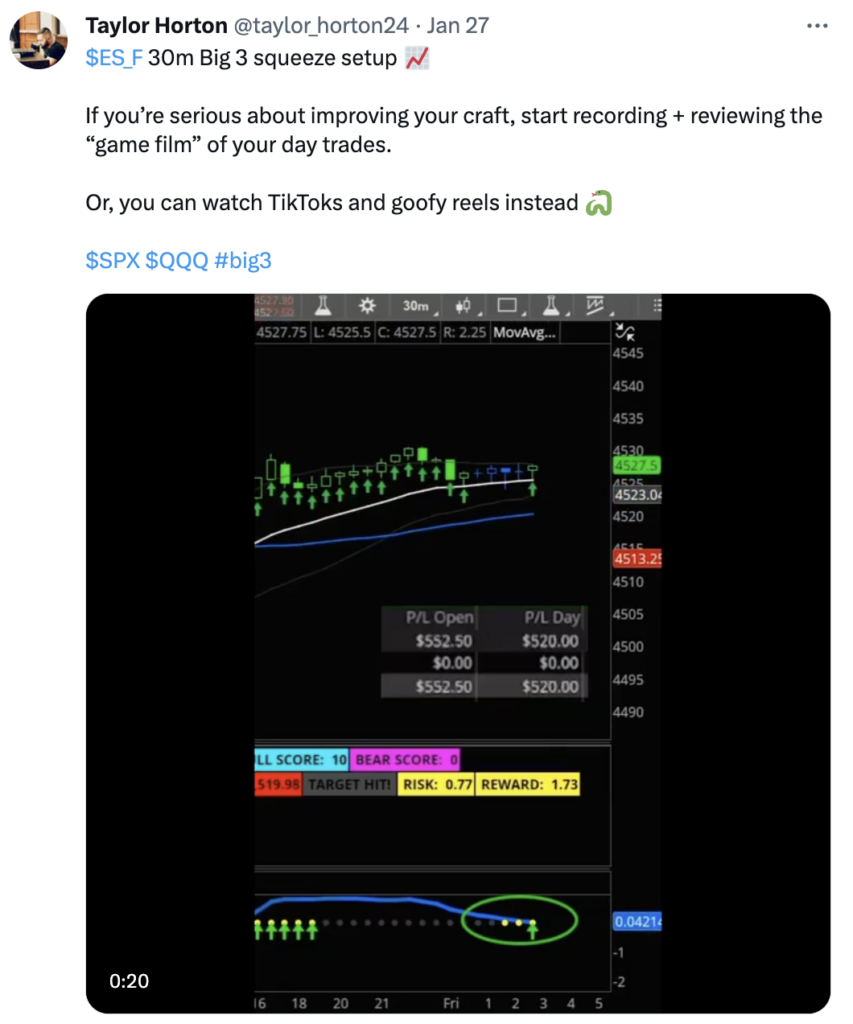
$IWM: very much like $SPX back in April, there's a monthly squeeze printing here with a slingshot signal.
This is our early "heads-up" that this sqz may turn higher and trigger a move into previous ATH's.
For now, watch the 2D + D squeezes as they'll be the first to go for it pic.twitter.com/dggMKkbKNp
— Taylor Horton (@taylor_horton24) February 9, 2024
Stay Focused,
Taylor Horton