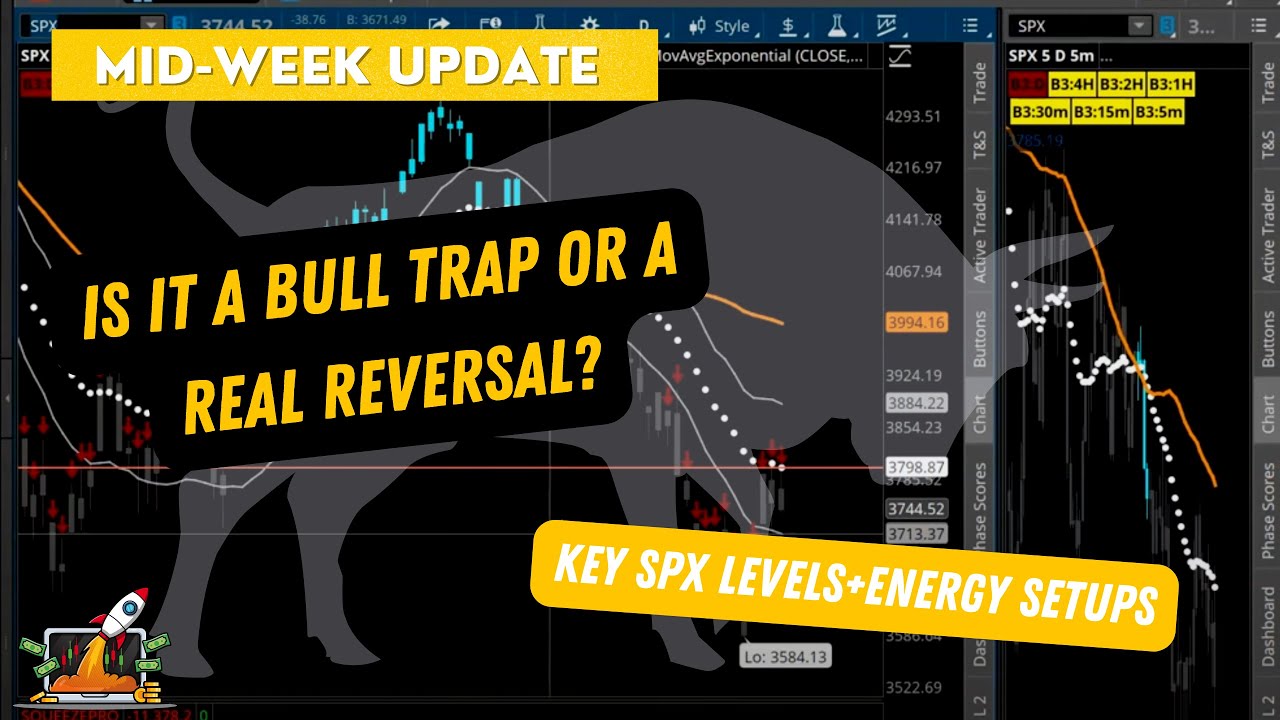
focused-trades-logo-w-taylor
focused-trades-logo-MOBILE

My Favorite Setups: Big 3 Signals + Squeezes (SPX to 200SMA?)


The bulls have made progress over the last week. In the short term, we could see the S&P 500 (SPX) move toward the 200 simple moving average (SMA) around $4,100. We’ll compare the market now versus in August since that was the last time the market rallied for longer than a few days. We’ll also cover some of the pieces of the puzzle including VIX, HYG, and DXY for a full market breakdown.


Tech Earnings on Deck: META, AAPL, AMZN


This week’s big tech earnings reports like Microsoft (MSFT) and Google (GOOGL) have created a roller-coaster market. For the upcoming reports on Thursday, Shopify (SHOP) reports before the open, followed by Apple (AAPL) and Amazon (AMZN) reporting at the close.

Coming into the week, my thesis unfolded perfectly. The S&P 500 (/ES) rallied this week to the 50-day simple moving average (SMA) at $3,887.

In the video above, we’ll discuss key levels and major zones to watch on /ES. We also break down GOOGL levels after bad earnings.

If you are interested in my strategy, check out my most recent webinar on how I’ve scalped consistently in this market: https://www.youtube.com/watch?v=Yoy7B8Gd46A

Q3 Earnings Set to Fire Up Market During OPEX


This earnings season, focus on the relationship between good or bad earnings and if they get rewarded or sold off.

Most importantly, if a company has good earnings, let’s see if they go higher… Such as Netflix #NFLX, who beat estimated earnings on Tuesday, creating a stellar move for Netflix as the S&P 500 (/ES) continued lower.

Be open-minded this week as the market is making large rallies and reversals during Options Expiration (OPEX).

In the video above, we’ll discuss key levels and major zones to watch on /ES. We also break down NFLX levels after earnings.

If you are interested in my strategy check out my most recent webinar on how I’ve scalped consistently in this market.

FREE INDICATOR: MA Cross Bars (Bullish + Bearish Signals)


For today’s video, I want to cover a free indicator that I want to hook y’all up with. Two moving averages I’m a fan of are the 21 exponential moving average (EMA) and the 50 simple moving average (SMA). When the 21 EMA is under the 50 SMA, the path of least resistance is typically to the downside. The indicator we’ll review today visualizes this “path of least resistance”.

MA cross bars for TOS: http://tos.mx/Slf8hsb


Bull Trap or a REAL Reversal: Key SPX Levels + Energy Setups


Let’s take a look at the pieces of the puzzle, including the Dollar (DXY), HYG, and the Volatility Index (VIX). We’ll review three important names: AAPL, TSLA, and AMAZN. Then we’ll lay out key SPX levels for tomorrow’s session and where the Big 3 buy signals are. We’ll finish off reviewing energy stocks, which might be one spot in the market we might be able to get long.