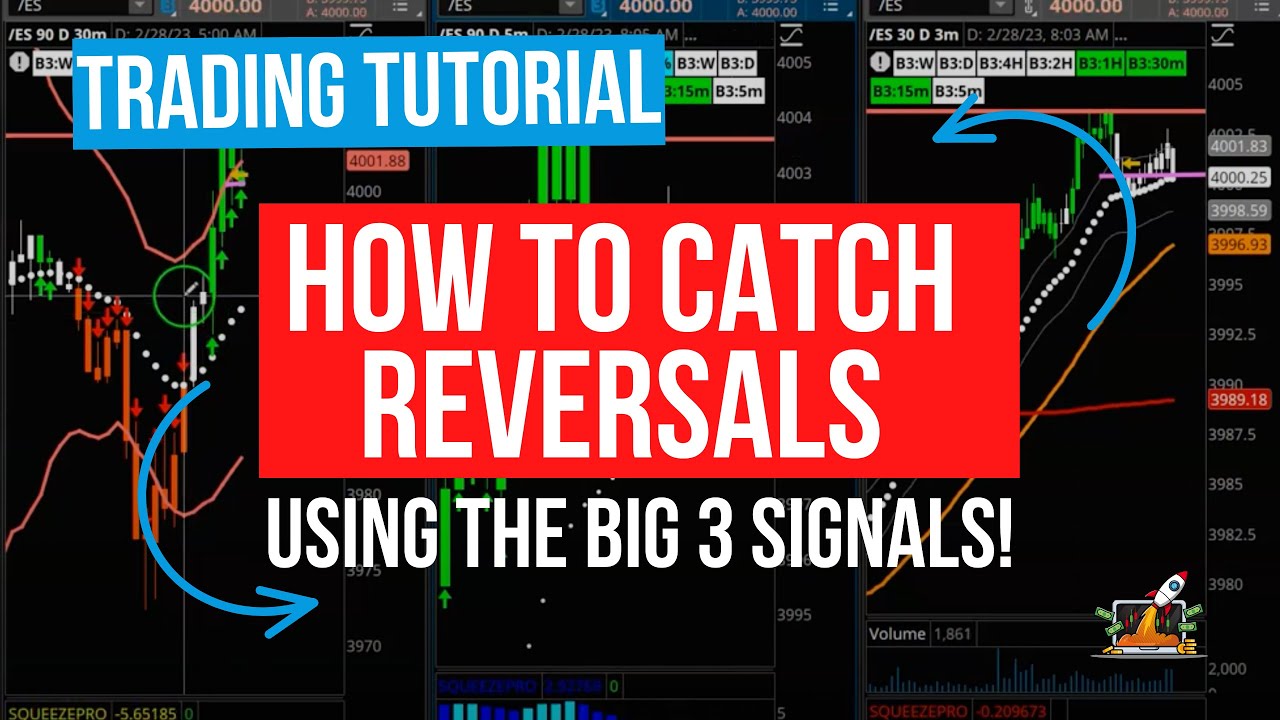
Platform problems kept me from taking the trade 😅… However, here’s a good walkthrough of how to spot + catch reversals using “exhaustion signals” from the Big 3 indicator.
Overbought on the 30 minute chart + exhaustion bars on the 1m-5m = reversion to the mean!
Bigger names like GOOGL and AMZN appear on the Big 3 sell signal scan. This shows which direction the market might be leaning toward more…
In the video above, we’ll discuss the ideal entry zone for these names on our watchlist. We’ll also scan for names that we could potentially look to enter for a good short opportunity next week.
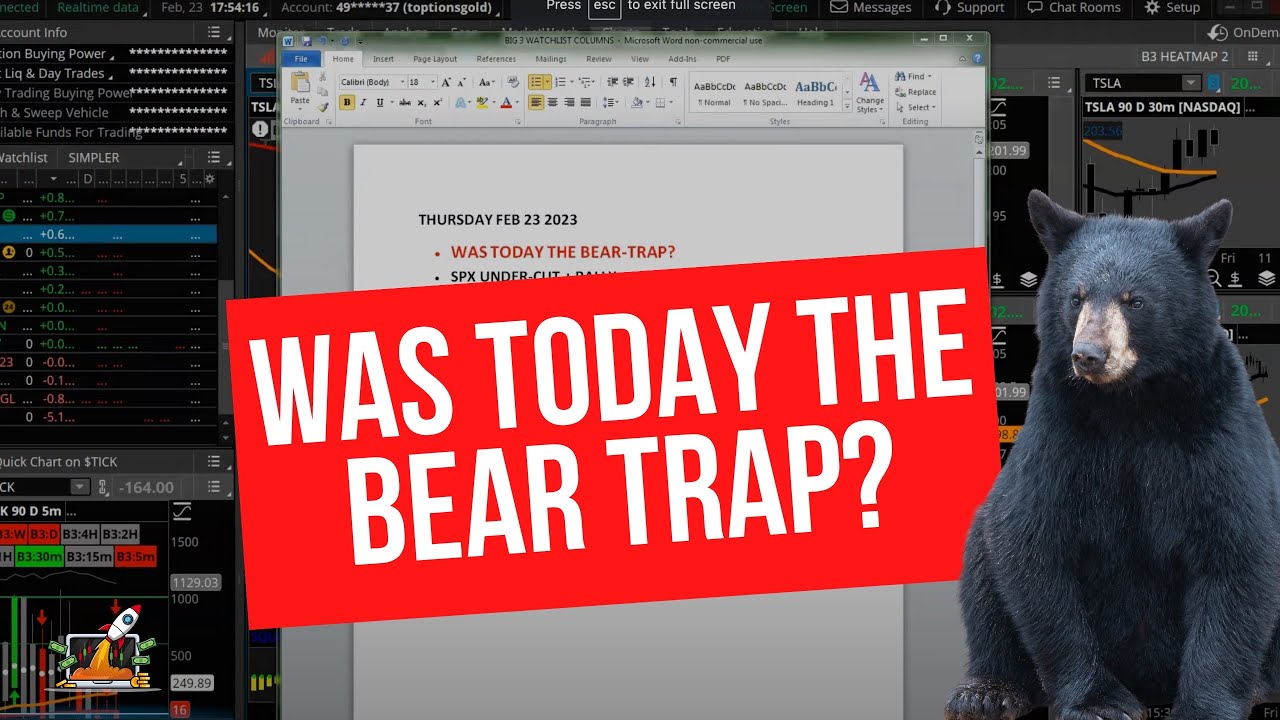
Getting on the short side of this market has been a good decision thus far. Our 4100 call credit spread we opened in the Compounding Growth Mastery last week is rockin’ and rollin’!
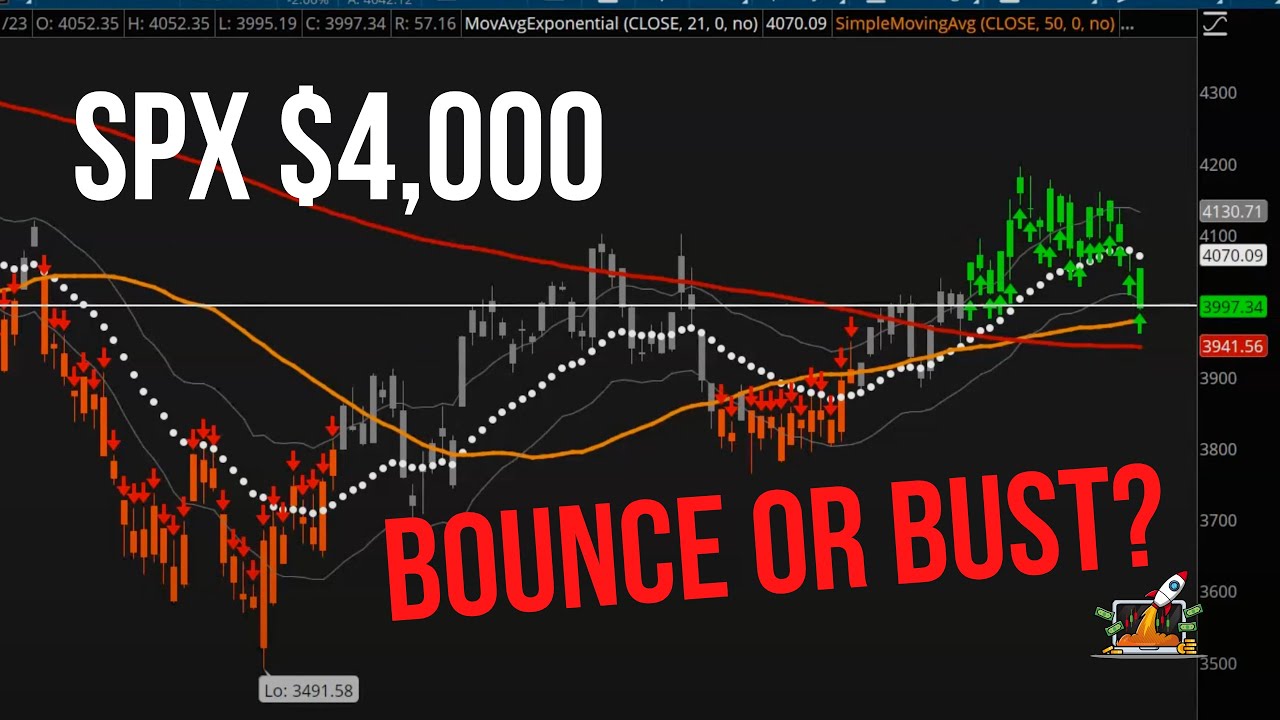
The bulls have given back most of their progress. The SPX is below the 21 exponential moving average (EMA), below the 50 simple moving average (SMA), and printing a new daily Big 3 sell signal.
In the video above, we’ll lay out the key levels that are lines in the sand for the bulls to have a chance to bounce again. We’ll also review the Dollar (DXY) and the junk bonds (HYG) to build on our thesis.
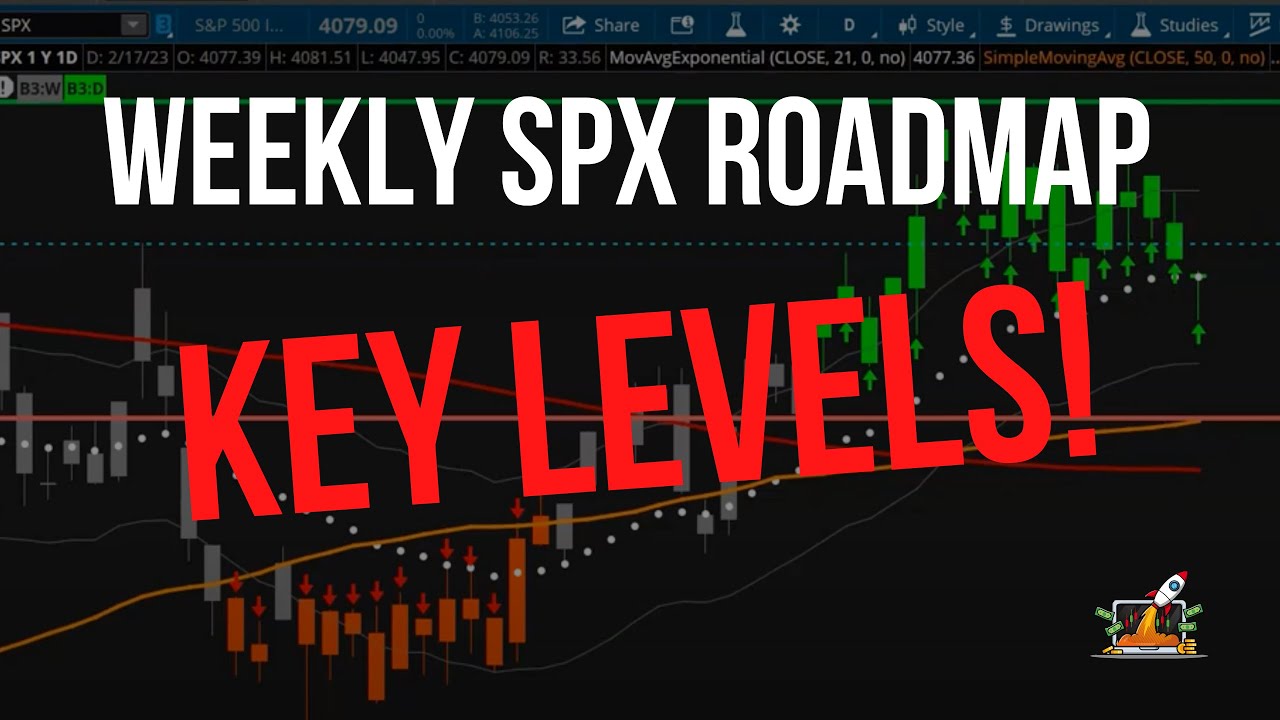
Today Im breaking down my $SPX road map for the week ahead and a few major targets I have for the upside and downside.
The daily chart is showing bullish signs but we still haven’t seen a daily buy signal. This gives the upperhand confirmation for the bulls, let’s see if we head higher.
Note: The market is closed on Monday, February 20th for President’s Day.
One of the problems for the market is the DXY. We use the Dollar as a correlation for the equities market. If the DXY can’t get under the daily 21 exponential moving average (EMA), we’ll continue to see the selling pressure on the S&P 500.
The HYG is another problem, as it’s lost strength and started breaking down. This is bearish for the equities, and we’ll need to see HYG get back above the moving averages to push for a rally.
Until these problems change, take caution when going long.
In the video above, we’ll cover the charts and get ready for the week ahead. We’ll also review the new call credit spread we opened on the SPX in the Compounding Growth Mastery.
The good news for the bulls is the new daily buy signals on the Big 3 indicator. For the first time in over a year, the SPX, QQQ, XLK, SMH, and other names have the Big 3 indicator turning bullish. This ultimately means that the trend has shifted in favor of the bulls.
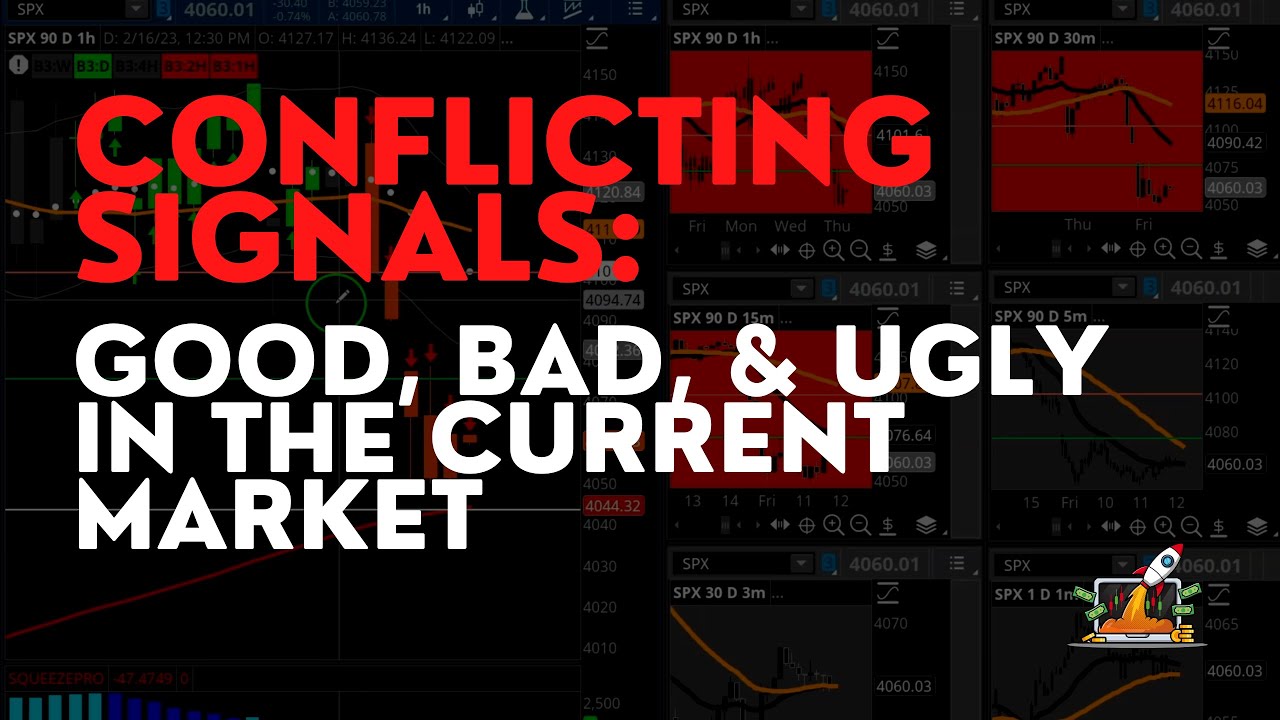
The bad, though, is slightly outweighing the good. The S&P 500 is bullish, with a squeeze on the daily chart and trading near the 21 exponential moving average (EMA). The problem is the lower time frames, shown on the Big 3 Heat Map, are printing Big 3 sell signals. The S&P 500 won’t get that explosive rally to the upside if the lower charts are bearish.
In the video above, we’ll review the DXY and HYG and what the current market conditions mean heading into the shortened week ahead.
The good, bad, and UGLY in our current market. Admittedly, I’ve been a bit too focused on the “good”, and should have been more mindful of the negative divergences between the indices and key products. BUT, that’s what we’re here to discuss this morning ✊🏽
It’s a battle between daily charts and lower timeframes.
The daily charts have been leaning towards wanting to buy the dip for now. The semiconductor sector, names like NVDA and AMD for example, are printing their first daily Big 3 Buy signal in over a year.
There are a lot of names poised here for a push higher. As they’re pulling back to the buy zone, be patient, but be ready for things to turn the corner.