focused-trades-logo-w-taylor
focused-trades-logo-MOBILE

Eventful Week Ahead


This week is full of economic reports and market events.

The Consumer Price Index (CPI) report will be released on Tuesday at 8:30 a.m. Eastern. Wednesday is the FOMC announcement at 2 p.m. Eastern, followed by Jerome Powell speaking at 2:30 p.m. On Thursday, both Jobless Claims and Retail sales release at 8:30 a.m. Eastern. The last report on Friday is the Purchasing Managers’ Index (PMI), releasing at 9:45 a.m. Eastern.

This week’s other market events are S & P Rebalancing, Triple Witching, and SPX roll. Approach the week cautiously, and be aware of putting too much risk during a very volatile week.

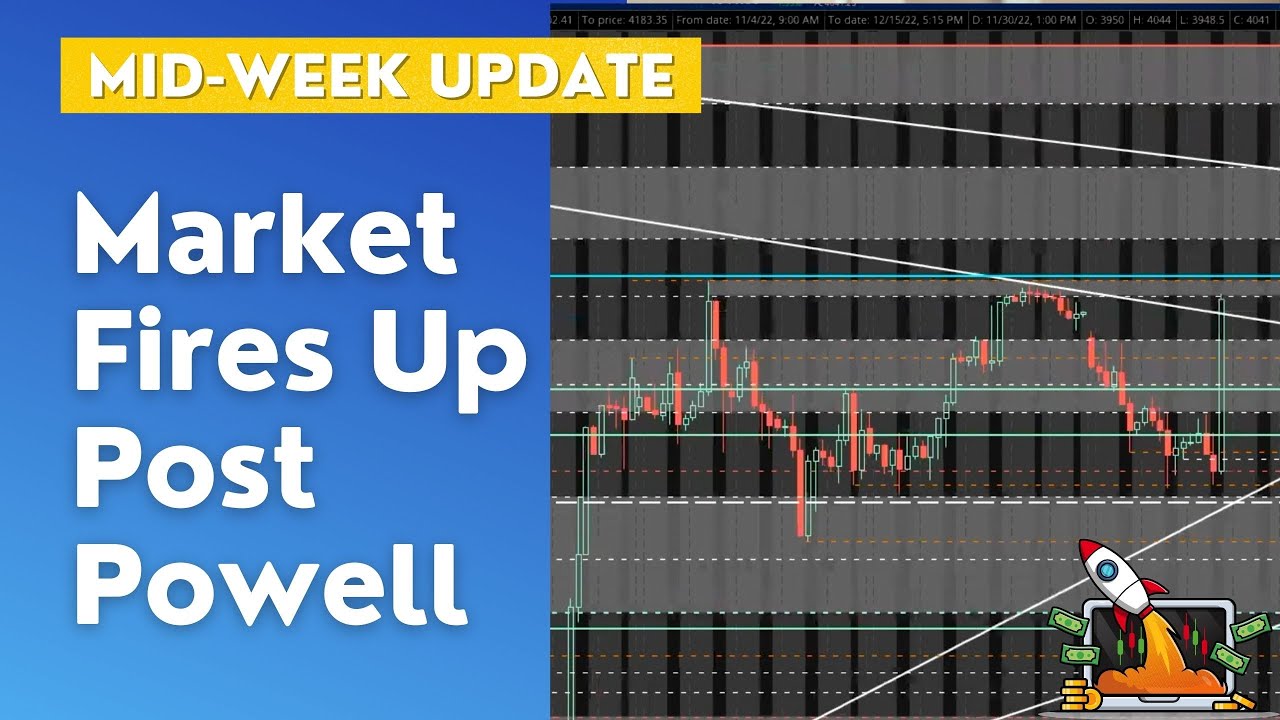
To start the week, the S&P 500 (/ES) is breaking our structure towards $3,981. Let’s see if the market can reach the top of our zone at $4,019 or break down to the Point of Control (POC) at $3,938.

Check out the video above to get a breakdown of my critical levels and possible scenarios on /ES as it breaks through structure.

Stay Focused!


Solar Sector Holds Strong


The key moving forward is making sure the bulls can handle the dips. We’ve seen a pattern this year where the bulls make progress, and on the first good dip the bears erase all that progress.

We are currently long TAN, the solar sector, in the Compounding Growth Mastery. TAN is an “A+ setup,” as the weekly chart has a squeeze, bullish momentum on the MACD, and is printing bullish Big 3 buy signals indicated by the green arrow. We’re seeing the same bullish criteria on the daily chart.

In the Sunday watchlist video above, we’ll review good looking setups in ENPH (also in the solar sector), ON (in the semiconductor sector), DKS (in the consumer discretionary sector), and other strong setups to watch next week.

Stay Focused!


Testing the Bulls


Let’s take a look at this week’s price action. The major question is how the bulls handle the dip.

The bulls have made progress over the last few weeks, most noticeably on the lower timeframes. This week the market pulled back to the daily 21 exponential moving average (EMA) and is continuing to hold structure.

The market is still missing momentum though, which we can use the MACD indicator to observe. The S&P 500 (/ES) doesn’t have a positive cross yet on the weekly MACD and hasn’t since the market bottomed after COVID-19.

In the video above, we’ll review the proxies of the market and lay out what the market to be fully aligned for upside potential. Be cautious that the bears could wipe out all the bullish progress made recently as we’ve seen happen multiple times this year.

Don’t miss the next special session where Taylor works directly with members to share how he focuses on his Compounding Growth Technique which is designed for small and large accounts. No need to commit full-time. Snag A Trial Today

Stay Focused!

/ES Fading From Trend


This week’s technicals lead the market as it broke down.

On Friday, two economic reports end the week.

The Producer Price Index (PPI) will be reported at 8:30 a.m. Eastern, followed by the UMICH Consumer Sentiment Index at 10:00 a.m. Eastern. The UMICH report provides insight into overall consumer sentiment and inflation.

As mentioned in Monday’s newsletter, the S&P 500 (/ES) was sitting at a bigger-picture trendline. /ES rejected the trendline and has since rolled over. Pay attention as a newer structure is forming near the 21 exponential moving average (EMA) at $3,965. 

Check out the video above to get a breakdown of my critical levels and possible scenarios on /ES as it approaches a new structure.

Stay Focused!


Market Fires Up Post Powell


Two major events took place on Wednesday. The ADP Employment Report was released, and, more importantly, Federal Chairman Jerome Powell spoke. The market reacted very bullish to Powell’s economic outlook.

In the video above, I break down major levels I’ve been eyeing on /ES and my entry point if /ES pulls back.

/ES Major Levels Approaching


The last month of the year is here. Let’s end the year strong.

The week is filled with economic data.

On Monday, the first report will be the Purchasing Managers’ Index (PMI) at 9:45 a.m. Eastern, followed by the ISM Manufacturing Index at 10:00 a.m. Eastern.

On Thursday, Jobless Claims will be reported at 8:30 a.m. Eastern.

Friday’s reports include the Producer Price Index (PPI) at 8:30 a.m. Eastern and the UMICH Consumer Sentiment Index at 10:00 a.m. Eastern.

The S&P 500 (/ES) is sitting at a bigger-picture trendline. Even if /ES breaks structure, there are still major levels in play above around $4,327.

Check out the video above to get a breakdown of my critical intraday levels and larger time frame levels on /ES. We’ll discuss two setups in TSLA and ROKU and their major levels to mark.

Stay Focused!


Last Puzzle Piece for Reversal


The bulls have done well holding support thus far.

The Dollar index (DXY) is continuing to help the bulls on both the Hourly through the Daily charts.

HYG looks better than it has in a long time, since the market bottomed post-COVID.

The last piece of the puzzle is whether we see a positive MACD cross on the weekly charts. This will give us a tell if this is just another bear market rally or a reversal.

Stay Focused!

How Will This Market Handle Dips?


All in all, it was a good week for the Compounding Growth Mastery.

We closed our SPX put credit spread, took profits at the highs on NVDA, and took an exit for a loss on ADM, protecting our capital from larger losses.

We bought calls on the solar ETF (TAN), which has had a good start thus far. The TAN trade has buy signals across multiple time frames, and we’re looking for a push toward $90.

In the video above, we’ll review the current market conditions, observe names on our watchlist, and discuss the key moving forward, specifically on how the market will handle the dip.

Keep a look out for Sunday’s video where we’ll review the last puzzle piece needed for a reversal as well as other trades we’re potentially looking to open.

Stay Focused!

Deep Dive: Favorite Day Trading Patterns


As a day trader, there are four main patterns I’m looking for in the market.

The 4 patterns are:

  • Double Bottoms
  • Double Tops
  • Bull Flags
  • Bear Flags

These patterns are not only formed intraday but also on bigger picture charts. The combination of using both intraday and bigger picture can help add extra confirmation of market conditions to your trading.

In the video above, I break down these patterns and show different examples on various stocks. This video is for educational purposes, and the levels discussed are from 11/11/2022. Keep in mind these levels may not be accurate at this time.

Stay Focused!