focused-trades-logo-w-taylor
focused-trades-logo-MOBILE

Pullback or Blastoff?


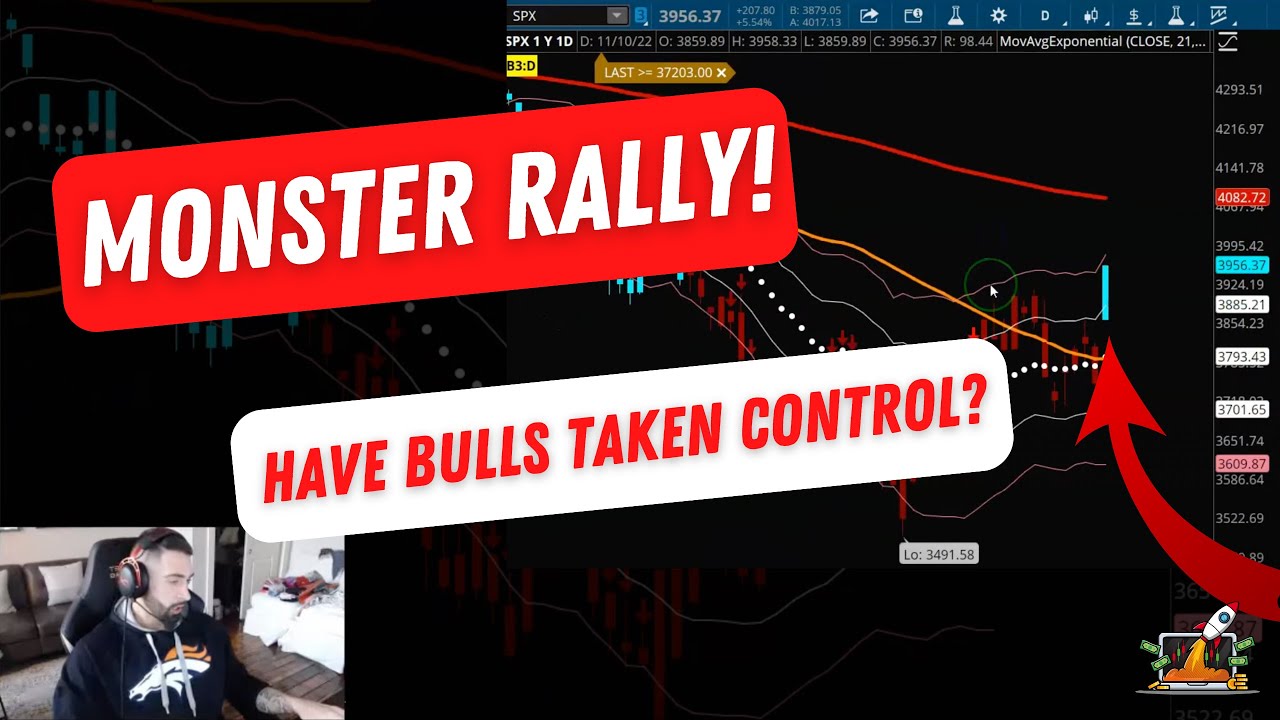
The market ended last week on a strong note.

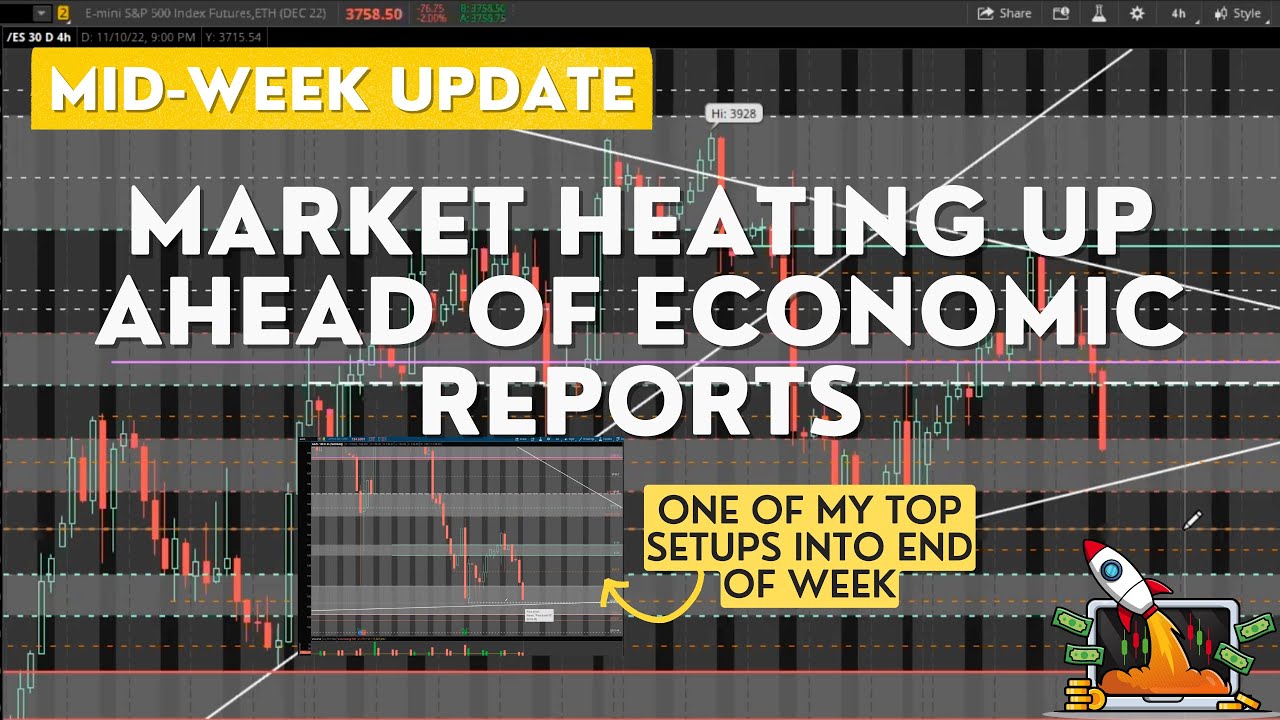
Coming into the week, there are a few economic reports, all reporting at 8:30 a.m. Eastern. The first report will be the Producer Price Index (PPI) on Tuesday. On Wednesday, Retail Sales will be reported, with Jobless Claims to follow on Thursday. One thing to keep in mind is Options Expiration (OPEX) on Friday, which could cause extra volatility and premium crushing this week.

Two earning reports to watch this week are Nvidia (NVDA) on Wednesday and Applied Materials (AMAT) on Thursday, both reporting after hours.

After last week’s monster rip, see if the S&P 500 (/ES) pulls back. My pullback target is the daily Ichimoku Cloud top at $3,950. If /ES holds $3,950, see if it continues back toward $4,000. If /ES pulls back and breaks $3,950, my first target is $3,875. My second target is Point of Control (POC) at $3,866.

If /ES continues higher and gets through $4,000, my larger upside target continues to be the 200-day simple moving average (SMA) at $4,080.

Check out the video above to get the breakdown of my critical level on /ES and /NQ and my thoughts on my favorite setup in AAPL.

Stay Focused!


Bulls’ Best Chance


Depending on what your market proxy is, now seems like the bulls’ best chance since 2020 to take back control.

If you focus on the relationship between the Dollar (DXY) and the market, we know that strength in the dollar is bad for the market and weakness in the dollar benefits the market.

There are major signs here that the dollar is breaking trend, which is a strong indication that the path of least resistance in the short-term could be for the bulls.

In the video above, we’ll focus on the structure of the market and key factors to look out for going forward.

Stay Focused!


Continuation of Market Strength?


The market cooled off a bit on Friday following a crazy bullish move on Thursday.

The S&P 500 (SPX) is starting to dip back to the 15-minute 21 exponential moving average (EMA), but it still has a long way to go considering the 30-minute 21 EMA is below at $3880.

The question for next week is do we get a continuation in the strength of the market next week.

In the video above, we’ll review our game plan for our open positions on CF (which has been an illiquid pain lately) and OXY (which had a strong day on Friday). Get Taylor’s trade alerts and weekly live trading in the Compounding Growth Mastery. Snag a $7 trial for 30 days here.

In Sunday’s video, we’ll review the structure of the overall market and the bulls’ chance of taking back control in the short term.

Stay Focused!

MONSTER RALLY! Have the Bulls Taken Control?


Have bulls taken control of the market? Is this rally here to stay? Check out the video above, where I dive into Thursday’s monster rally in the market after Consumer Price Index (CPI) report, how this rally affected $DXY and my thoughts on where the market could be going from here.

Monster Rip After CPI


The market had a monster day on Thursday after the Consumer Price Index (CPI) report showed less than expected. Let’s see if the rally continues into Friday.


Coming into the week, one of my main targets to the upside was the structure above near point of control (POC) at $3,866. After breaking $3,866, the S&P 500 (/ES) continued to rally and closed around $3,965.

If /ES continues higher and gets through $4,000, my larger upside target is the 200-day simple moving average (SMA) at $4,084.


Check out the video above to get the breakdown of my critical level on /ES and /NQ. 


Stay Focused!


Options Trading: Market Heating Up Ahead Of Economic Reports


After Election Day on Tuesday, we still have additional economic reports releasing this week. At 8:30 a.m. Eastern on Thursday, both the Consumer Price Index (CPI) and Jobless Claims will be reported. Let’s see how the market digests all this information into the end of the week.

Last week the S&P 500 (/ES) hit my major structure trendline around $3,900. After the FOMC event and Powell’s speech, /ES broke $3,900 and got below the daily 21 exponential moving average (EMA) near $3,784.

As the market found its feet this week, my main target was getting back to liquidity at $3,866, the point of control (POC). Once /ES got to $3,866, it dropped and broke $3,784 during Wednesday’s session.

Will Thursday’s economic data guide the market down further or help pick it back up?

Check out the video above to get the breakdown of my critical levels on /ES. I also discuss my focus list setup on AAPL, as huge levels are in play.

Stay Focused!


Election Day On The Way


There are two major catalysts heading into the week. Tuesday is election day; politics aside, the market is always looking at who is in power and making decisions. At 8:30 a.m. Eastern on Thursday, both the Consumer Price Index (CPI) and Jobless Claims will be reported.

AAPL gapped down on Monday after its announcement over the weekend that they are cutting their outlook for iPhone shipments due to China lockdowns.

After breaking structure during last week’s FOMC event, the S&P 500 (/ES) continued to reject the daily 21 exponential moving average (EMA) near $3,784. Overnight on Monday, /ES broke above $3,784 to start the week.

The market is near a problematic range of targets from $3,800 to $3,820. If /ES gets through $3,820, see if /ES can head toward the structure above near point of control (POC) at $3,866. If /ES breaks $3,784, my main target below is the structure near the zone from $3,763 to $3,735. If /ES breaks $3,735, see if it can drop to last week’s low of $3,704.

With major rotation happening, the Nasdaq-100 futures (/NQ) has been hit the hardest. If /NQ can break through Friday’s high of $10,396, my first target is $11,100, and my second target is the daily 21 EMA around $11,200. If /NQ rejects $10,942 and breaks point of control at $10,800, I have two major downside targets. My first target is last week’s low of 10,656; my second target is the low of the year at $10,484.

Pay attention to the volatility index (VIX) as it approaches a major level of $25 and how that may impact the market.

Check out the video above to get the breakdown of my critical levels on /ES. I also discuss structure on VIX and review my focus list setup on AAPL with essential levels to watch.

Tune in to trade SPX, and other potential opportunities in the market with me live in the Simpler Day Trading room. Try a $7 one-month trial!

Stay Focused!


AAPL Outweighing the Market


There’s one sector holding back the market and the strongest of sectors. It all comes down to AAPL and a weak technology sector (QQQ).

The market is showing signs of progress, and charts are rebuilding on the S&P 500 and other strong sectors like energy (XLE), the financials (XLF), and healthcare (SLV). To tie a bullish move together, there needs to be signs of improvement from AAPL and the QQQ. Otherwise, the market will likely trend lower.

While GOOGL and MSFT attempt to pull the tech sector up, it’s not enough to pull the market higher with such an “ugly” AAPL chart. As nasty as AAPL looks, it is very oversold.

For now, we’ll need to anchor to the few things that act as key support, which we’ll cover again in the video above. 

Stay Focused!


The KEY Levels for Today’s Session! SPX, DXY, HYG


The bulls have made progress over the last week. In the short term, we could see the S&P 500 (SPX) move toward the 200 simple moving average (SMA) around $4,100. We’ll compare the market now versus in August since that was the last time the market rallied for longer than a few days. We’ll also cover some of the pieces of the puzzle including VIX, HYG, and DXY for a full market breakdown.

Options Trading: FOMC Shaking Up The Market | Focused Trades


On Wednesday’s FOMC Event, the fed announced a hike in Interest Rates to 0.75. Jerome Powell spoke after causing the market to react negatively to his comments on if high rates are here to stay in the long term. Note these two other reports are releasing this week. On Thursday at 8:30 a.m. EST, Jobless Claims will be released, and Non-Farm Payroll will be reported on Friday. This week the S&P 500 (/ES) held structure and my bigger picture trendline around $3,903. After Wednesdays FOMC Event, /ES broke my main downside target at $3,850, the 50-day simple moving average (SMA). In the video above, we’ll discuss major levels to watch on /ES after FOMC. We also break down my key targets on AAPL.