The big $AAPL = the big problem!
This Chart of $AAPL is a HUGE PROBLEM For the Market: The Nail in the Coffin?
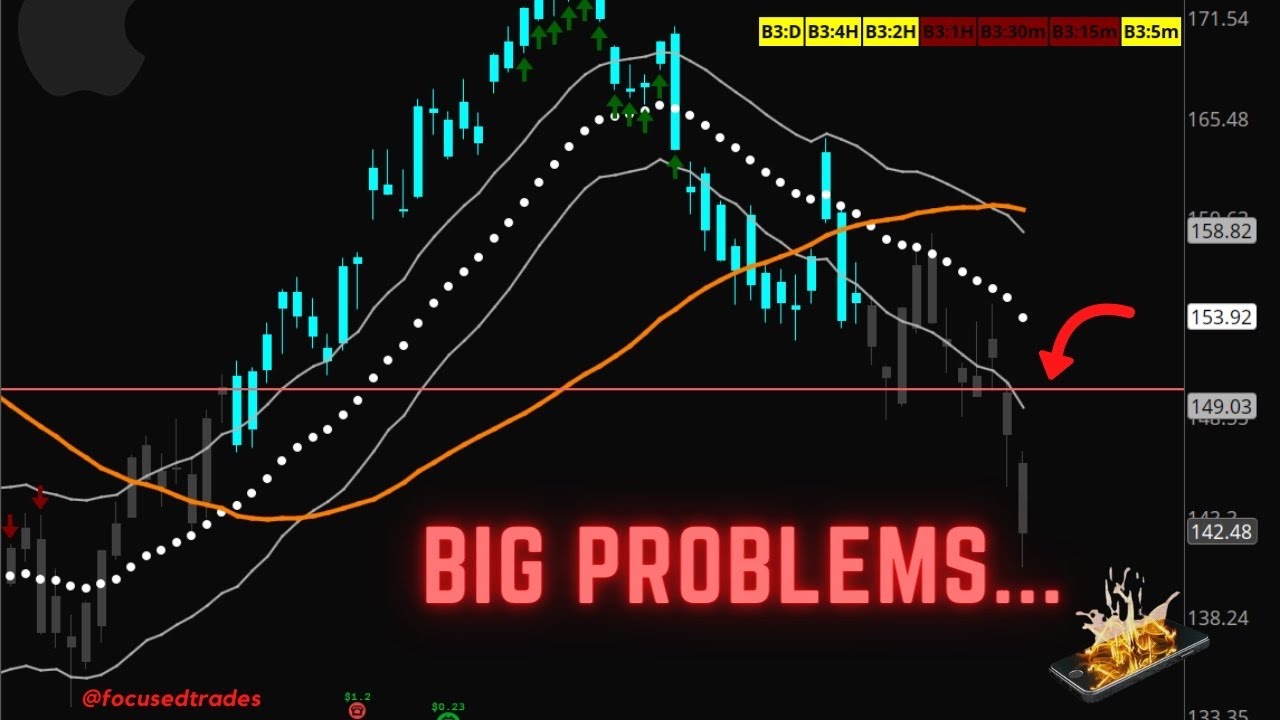
The big $AAPL = the big problem!
This week we have Jobless Claims on Thursday and PCE Price Index on Friday, both at 8:30 a.m. Eastern. As the S&P 500 (/ES) continued lower this week, the main target was our prior low of the year at $3,639 and a bounce back to structure around $3,735. With the market holding $3,735, there are a few other targets to keep in mind. In the video above, I dive deep into key levels on /ES. My main focus this week is the overall market and trading SPX.
Monthly squeezes can pack a serious punch, and so can weekly squeezes. Right now, the SPX is squeezing on both time frames, and the structure is leaning in the favor of the bears 🐻 Will these squeezes fire short and take us back to pre-covid levels? Or do you think the market will bottom much sooner? Let me know in the comments! Either way, I’m here for the ride 📈📉
Taylor got married! (Peep the video for pictures)
Back to work here, and we’ll review the watchlist for the week. Everything implies the June lows will not hold. The market is oversold, so maybe we’ll get a bounce to be able to short this week.

Good morning, traders! Ahead of Fed Day (Jerome Powell speaking), we want to keep our focus simple and anchor to a few important things.

We had another wild and wacky week in the books. We’ll take a look at a few charts and key levels in focus for the week ahead.
Wow, what a day. Thursday had insane price action with a huge gap down after the Consumer Price Index (CPI) reported, a stop at a major zone, and a monster reversal up.
It’s all about economic data this week, and Thursday’s price action is proof of why we want to pay attention to the economic calendar. The CPI report woke up the market and dropped it heavily before the major pop.
On Friday, Retail sales will report before the market opens. News accelerates technicals, so be wary of how the results impact the market.
The biggest thing that was our focus this week was the low of the year at $3,571. We laid out targets below at $3,541 and $3,506.
After the CPI numbers were released, price hit our major zones below, broke back through the low of the year, through the CPI candles and liquidity zone, and hit the $3,700 range we’ve been discussing.
In the video above, we’ll lay out key liquidity levels and zones to watch on /ES and the Volatility Index (VIX).
Stay Focused!
There are major economic reports being released this week.
On Wednesday we have the Producer Price Index (PPI) at 8:30 a.m. Eastern following the Federal Open Market Committee (FOMC) minutes at 2:00 p.m. Eastern. To end the week, we have the Consumer Price Index (CPI) on Thursday and the Retail Sales report on Friday, both at 8:30 a.m. Eastern.
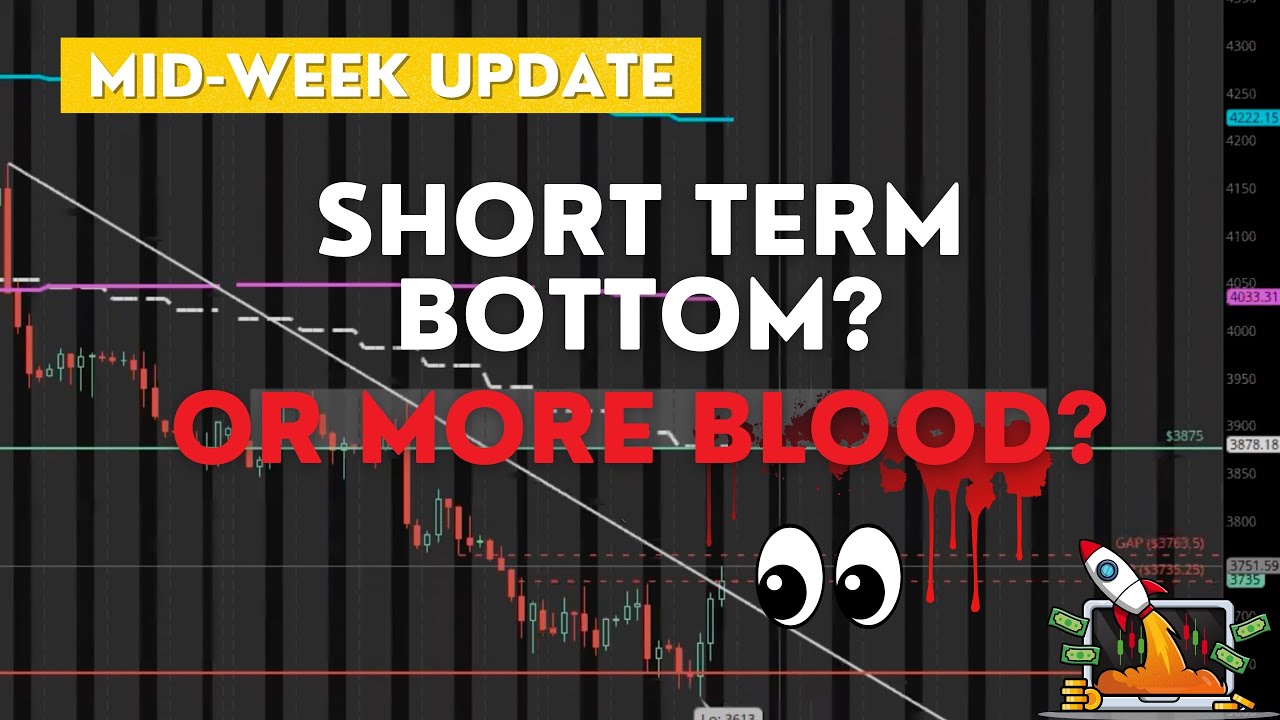
After rallying on Friday, the S&P 500 (/ES) sat at $3,792, its point of control (POC). /ES then broke a major structure to the downside, breaking last month’s POC at $3,669. The major index ended the week at $3,639.
This week, see if /ES can hold $3,639 and pop toward structure around $3,700. If /ES continues higher from there, my next target is the previous gap-fill target of $3,735. If /ES breaks $3,639 and heads lower, my first target is $3,613. My second target is the low of the year at $3,571.
For a bigger picture thesis, if /ES can’t hold the low of the year at $3,571, my major downside target is the pre-COVID-19 high of $3,397.
Last month’s thesis that the Volatility Index (VIX) would approach $35 unfolded perfectly with the market. As the market goes lower, VIX will move higher toward $35 again. If VIX guides lower and causes the market to pop, it could break $26 and make its way to $25.
AAPL continues to be our compass for the market. See if AAPL breaks structure around $140 and moves toward $137. Similar to the market, I have a major downside target of $129, the low of year. If AAPL holds structure around $140, see if it can pop toward $146 and head to $149, the daily 21 exponential moving average (EMA).
My main focus for this week is SPX. Watch the video above to see which key levels and structure I’m noting on /ES.
Stay Focused!
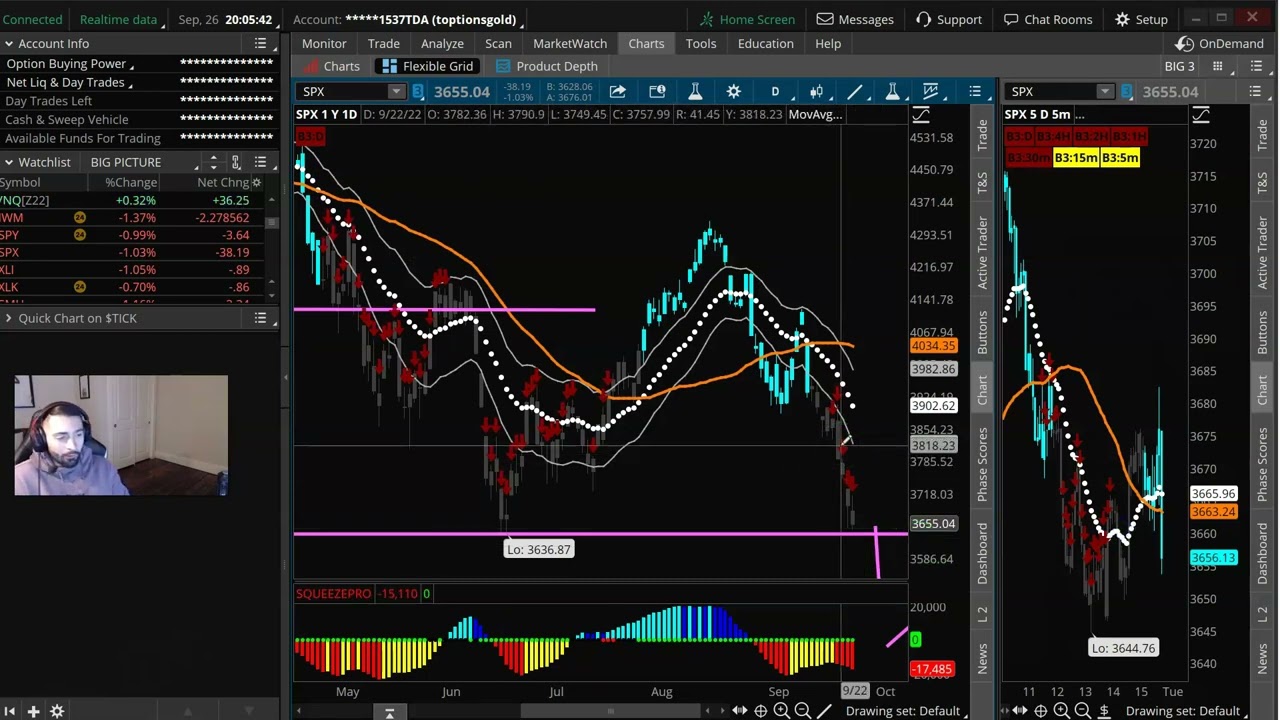
The S&P 500 (SPX) short squeezed into Thursday. SPX never reached above the 21 exponential moving average (EMA) and continues to show a daily Big 3 sell signal. With no true confirmation for an entry, the best thing we did this week was to stay patient and not get caught up in the short squeeze.
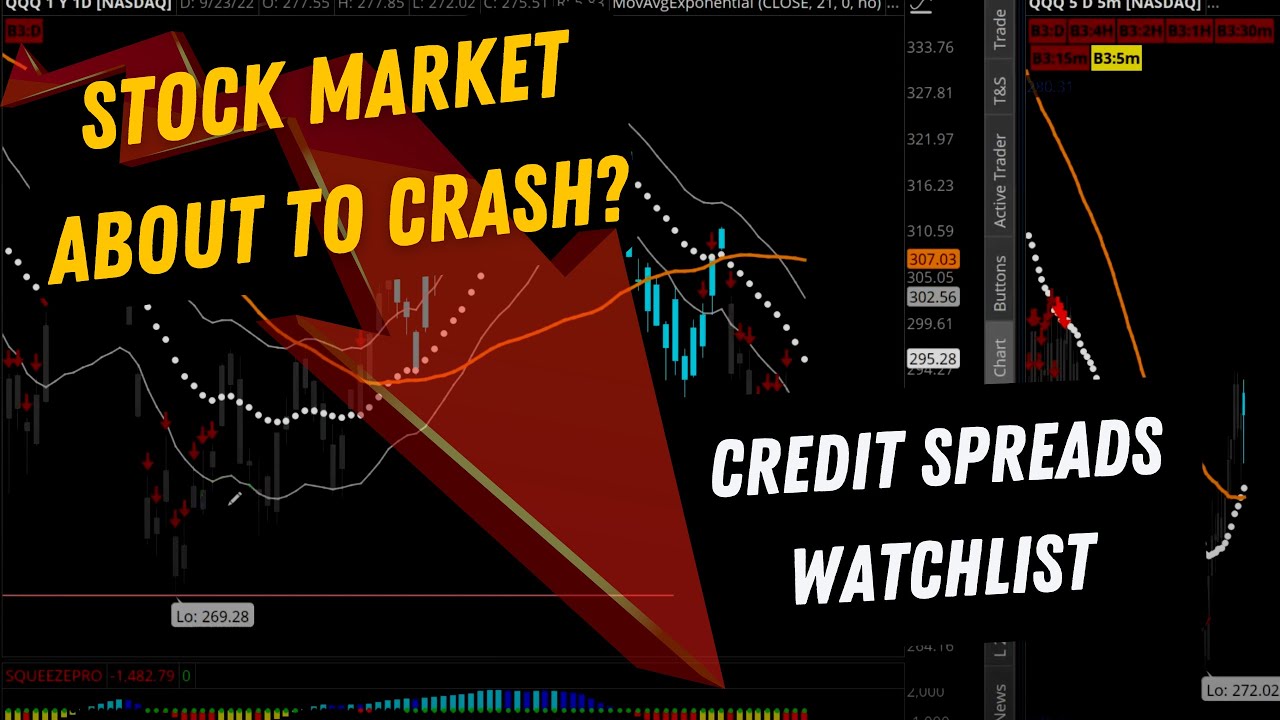
Keep in mind that SPX is showing its first daily negative Squeeze Pro histogram since 2008. Now that SPX is showing bearish momentum and under the 21 exponential moving average (EMA), it could indicate that our uptrend from this year is near an end.
With SPX gapping down on Friday, this leaves us heading into the weekend with the path of least resistance to the downside. Let’s take a look at the most important pieces of the puzzle heading into next week.
In the video above, we’ll review SPX and the pieces that are coming together to show that the change in trend is near. We’ll also review our put credit spread UNG position from this week and the call credit spread in AAPL for November expiration in my Compounding Growth Mastery.
Stay Focused!
There is one highly-anticipated report leading us into the end of the week, Non-Farm payroll on Friday at 8:20 a.m. Eastern. Also, keep in mind the Federal Open Market Committee (FOMC) minutes will be released next Wednesday, October 12th.
Monday’s newsletter unfolded perfectly with the S&P 500 (/ES) recovering the low of the year at $3,571 and pushing toward the gap fill from $3,735 to $3,763. /ES rallied through point of control (POC) at $3,792, hit the 21 exponential moving average (EMA) at $3,818, and is consolidating into the end of the week.
The /ES Point of control (POC) moved from $3,669 to $3,792 in the new month of October. This level is important as that is where the most liquidity is and the most buyers and sellers are.
If /ES can’t hold $3,751 my first target is the structure around $3,720. My second target is last month’s point of control (POC) at $3,669. If /ES continues to hold $3,763 see if it can get through the 21 exponential moving average (EMA) at $3,818 and hit my main upside target at $3,875.
My main focus to end the week continues to be SPX. Watch the video above to see which key levels and structure I’m noting on /ES.
Tune in to trade SPX and other potential opportunities in the market with me live in the Simpler Day Trading room, try a one-week trial!
Stay Focused!