focused-trades-logo-w-taylor
focused-trades-logo-MOBILE

Kicking Off Q3 Earnings Season


An interesting week is ahead of us as we approach earnings season.

Reports worth noting this week are Goldman Sachs (GS), reporting before the open on Tuesday, and Netflix (NFLX) reporting after the close. On Wednesday morning, ASML Holding semiconductor reports (ASML), followed by Tesla (TSLA) and Lam Research Corporation (LRCX). Ending the week, Snapchat (SNAP) will report after the bell.

Keep in mind one bad earnings report could guide the market much lower. Let’s see how the market reacts.

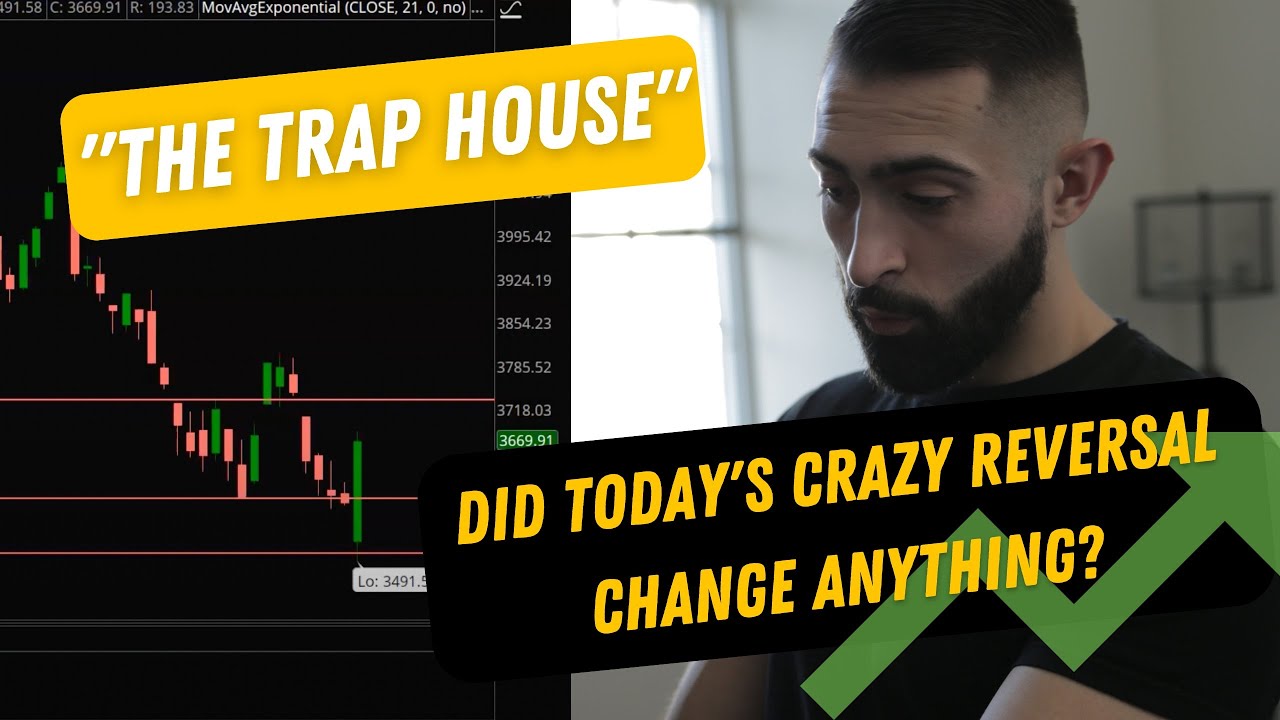
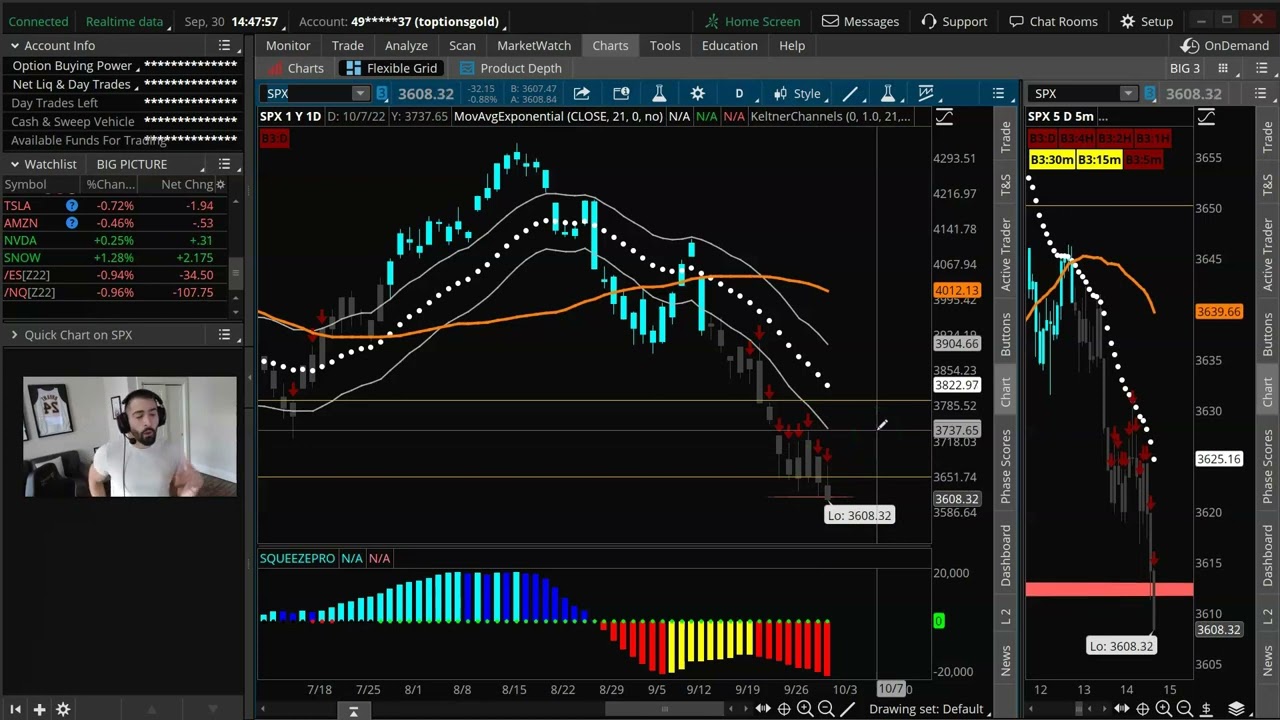
Last week the S&P 500 (/ES) broke the low of the year at $3,571 on the Consumer Price Index (CPI) report. In one day, /ES created a new low at $3,502 and reversed back to the daily 21 exponential moving average (EMA) at $3,722. /ES rolled back toward $3,587, ending the week messy on Friday.

Be open-minded this week as the market is making large rallies and reversals.

Two targets to focus on this week is the zone below structure at $3,639 and the overall structure from recent highs around the daily 21 exponential moving average (EMA) at $3,722.

Once we approach this structure, I’ll be looking for a potential rollover. Two key levels to the downside are the previous low of the year at $3,571 and the new low of the year at $3,502. If /ES breaks $3,502, my major downside target is the pre-ovid highs at $3,397.

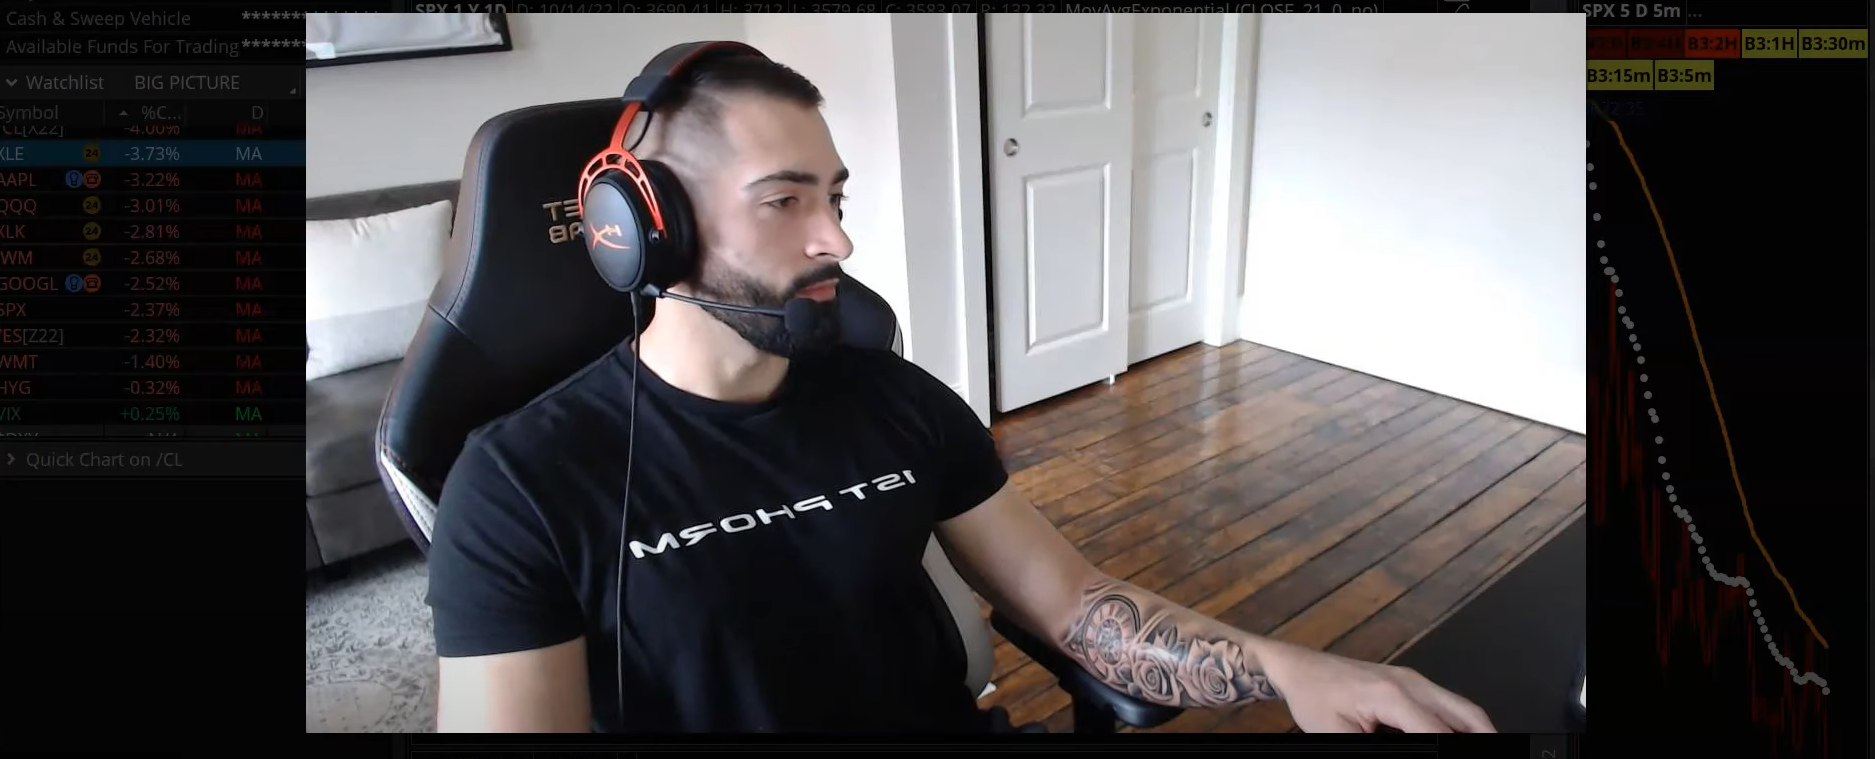
In the video above, we’ll discuss key zones and major levels to watch on /ES. We also discuss how AAPL is our major compass for the market and its key structure to watch.

Check out my most recent webinar on how I’ve scalped consistently in this market.

Stay Focused!


Bigger Picture ‘Pieces of the Puzzle’


The short squeeze theme continues.

We’ll review the “pieces of the puzzle” that we’ll use as an indication of a major trend change.

The Volatility Index (VIX) appears bullish. As long as the Volatility Index (VIX) is above the rising daily 21 exponential moving average (EMA), is in a daily squeeze, and has daily and 4-hour Big 3 buy signals, the market is in trouble.

The next piece of the puzzle, the U.S. Dollar Index (DXY), has a squeeze, is above its daily 21 EMA, and is also looking bullish (also a problem for the market).

HYG (junk bonds) also hasn’t changed as price is below the falling daily 21 EMA with Big 3 sell signals across the board.

In the video above, we’ll review the bigger picture structure on the SPX, break down the individual sectors, and list our current open positions on AAPL, WMT, and LNG in the Compounding Growth Mastery.

Stay Focused!


FREE INDICATOR: MA Cross Bars (Bullish + Bearish Signals)


For today’s video, I want to cover a free indicator that I want to hook y’all up with. Two moving averages I’m a fan of are the 21 exponential moving average (EMA) and the 50 simple moving average (SMA). When the 21 EMA is under the 50 SMA, the path of least resistance is typically to the downside. The indicator we’ll review today visualizes this “path of least resistance”.

MA cross bars for TOS: http://tos.mx/Slf8hsb


Bull Trap or a REAL Reversal: Key SPX Levels + Energy Setups


Let’s take a look at the pieces of the puzzle, including the Dollar (DXY), HYG, and the Volatility Index (VIX). We’ll review three important names: AAPL, TSLA, and AMAZN. Then we’ll lay out key SPX levels for tomorrow’s session and where the Big 3 buy signals are. We’ll finish off reviewing energy stocks, which might be one spot in the market we might be able to get long.