focused-trades-logo-w-taylor
focused-trades-logo-MOBILE

Will FOMC, Earnings Send Market Out Of Ranges?


Happy Halloween, everyone! Get ready for a spooky week ahead.

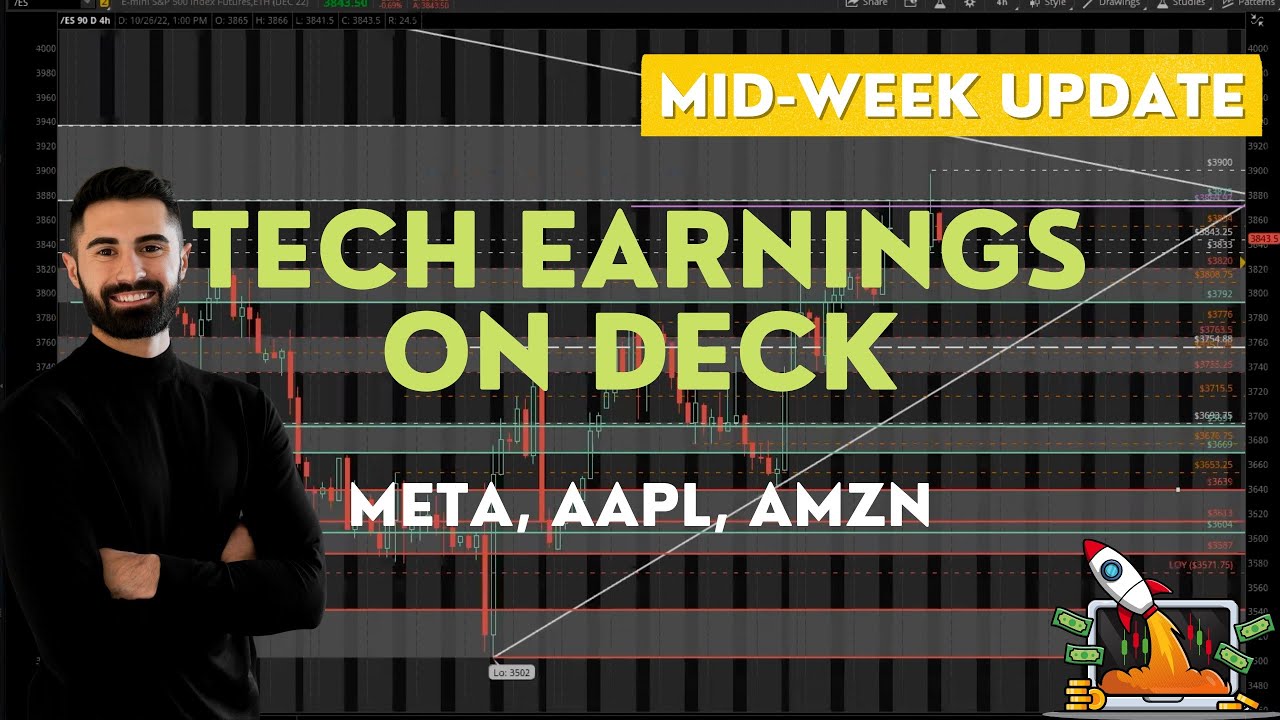
There are a few note-worthy earnings reports this week, all reporting after the market close. On Tuesday, Advanced Micro Devices (AMD) reports; Wednesday, Roku (ROKU) and Qualcomm (QCOM), followed by Coinbase (COIN) on Thursday.

Multiple economic data reports are being released this week. On Wednesday, the ADP Employment Report is set to release at 8:15 a.m. EST, followed by an FOMC announcement at 2 p.m. EST, and Jerome Powell is set to speak at 2:30 p.m. EST. At 8:30 a.m. EST, Jobless Claims will be released on Thursday, and Non-Farm Payroll will be reported on Friday.

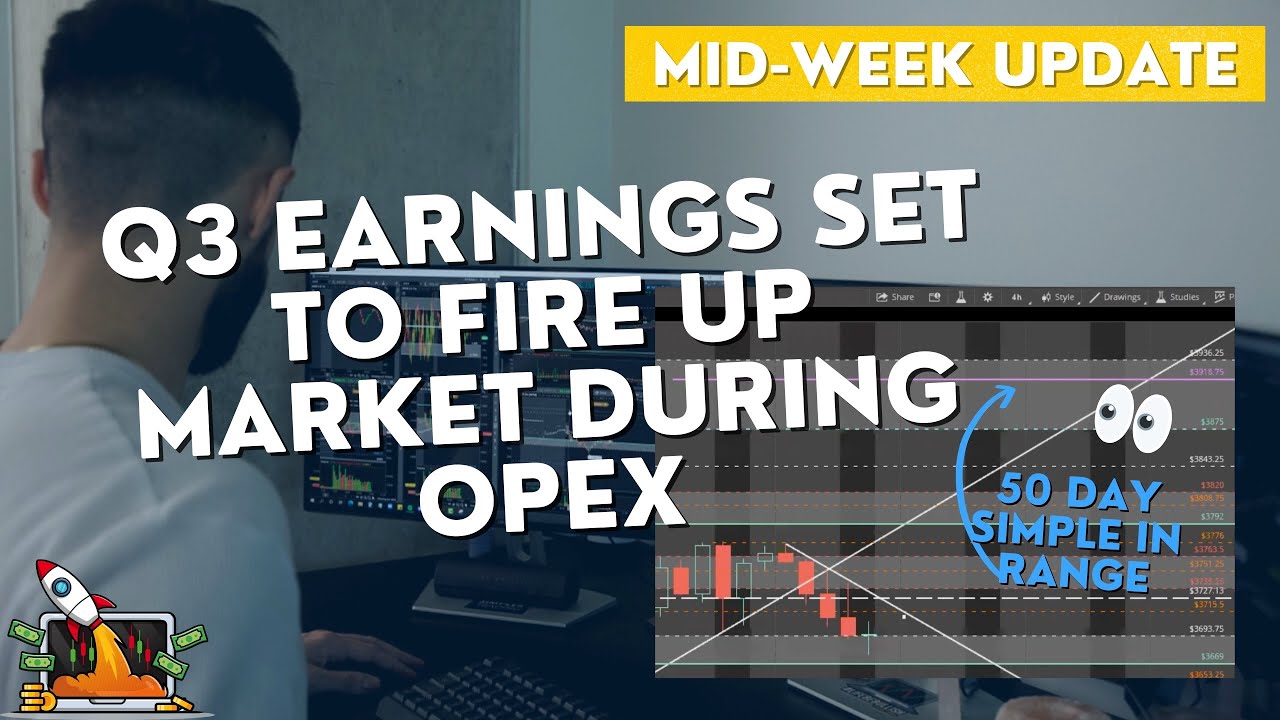
After last week’s messy tech earnings, the S&P 500 (/ES) held structure and closed at our bigger picture trendline around $3,903. With trendlines above and below, let’s see where FOMC takes the market this week.

If /ES breaks above $3,903, my following targets are $3,936 and the zone above $3,981. If /ES breaks below the trendline, my first target is the zone below $3,875. Two major downside targets are the 50-day simple moving average (SMA) at $3,850 and the daily 21 exponential moving average (EMA) near $3,785.

Remember that the market could stay range bound in this structure ahead of the FOMC event on Wednesday.

Two major compasses for the market this week are Amazon (AMZN) and Google (GOOGL).

After bad earnings last week AMZN had a large gap to the downside breaching their low of the year at $101. AMZN recovered and reversed through $101, ending Friday’s close at around $103. AMZN is a great compass for tech; see if they sell or buy to hold technology this week. With a gap from $103 to $109, see if AMZN can hold $101 and fill the gap to $109. If AMZN breaks $101, my main downside target is Friday’s close at $94.81.

Check out the video above to get the breakdown of my critical levels in GOOGL and AMZN. We also discuss zones and major levels to watch on /ES as it deals with bigger-picture structures.

Interested in my strategy? Trade live with me this week in my day-trading intensive!

Stay Focused!


Spooky SPX Setup


Happy Halloweekend!

The S&P 500 (SPX) is holding its bullish structure for now. Let’s define what factors must hold firm to maintain this bullish structure. We’ll set up an SPX put credit spread that assumes the short-term path of least resistance is to the upside.

We’re looking for more bullish trades similar to our NVDA trade taken in the Compounding Growth Mastery.

NVDA closed above the daily 21 exponential moving average (EMA), printed Big 3 Buy Signals on multiple time frames, and pushed higher for a quick profit. We’re patiently waiting to open new trades on our watchlist, including CF and TSLA, until the risk:reward ratio improves.

The plan is to wait for a dip before taking new entries, specifically out-of-the-money (OTM) put credit spreads.

I’ve been dabbling in futures for the last few months, so we’ll review some of the opportunities, advantages/disadvantages, and trade ideas I have regarding trading /ES.

Stay Focused!

Join John Carter, Taylor Horton, and Raghee Horner on Twitter Spaces at 3:15pm Central next Friday, November 4th. They’ll be discussing the changes they’ve made to their trading in 2022, and how they take advantage of this extreme volatility.

Bulls Maintain Progress, But For How Long?


The market is holding strong despite a drop in big tech earnings. Overall, names are improving in favor of the bulls in the short term.

Let’s review our latest setups on DKS and GIS, taken in the Compounding Growth Mastery. We’ll use my favorite “8-pack” chart layout to review the time frames from the daily chart down to the 1-minute time frame. We can use this layout to rate setups and determine if structure is working in our favor at a glance.

Surprisingly, we’re seeing a strong market after AMZN gapped down. This week’s theme shows the overall market is improving in the short term.


In the video above, we’ll review part of our market watchlist, including: 

  • VIX, $DXY, HYG
  • SPX/QQQ/IWM
  • NVDA + GIS
  • TSLA, /CL, CF

The S&P 500 (SPX) has kept its bullish progress thus far. The question is whether the SPX will look similar to September, where the market looked promising but fell apart. The other option is we see a month like August where we take advantage of the rally.

The Nasdaq (QQQ) is also rallying higher despite AMZN being down 10% after earnings on Friday. The QQQ canceled out the daily Big 3 sell signals and is trading back above the daily 21 exponential moving average (EMA).

META, GOOGL, and AMZN earnings aside, the market theme is that the bulls have made and kept a lot of progress. In the short term, we’re looking to keep buying the dips and find more trades like NVDA and GIS.

Stay tuned for Sunday’s newsletter, where we’ll cover trade setups I’m eyeing on CF, TSLA, SPX, and even the /ES Futures.

Stay Focused!

Join John Carter, Taylor Horton, and Raghee Horner on Twitter Spaces at 3:15pm Central next Friday, November 4th. They’ll be discussing the changes they’ve made to their trading in 2022, and how they take advantage of this extreme volatility.

Crucial Earnings: AAPL and AMZN


This week’s big tech earnings reports like Microsoft (MSFT) and Google (GOOGL) have created a fun roller-coaster market. We are ending the week with the most anticipated upcoming reports on Thursday, Apple (AAPL) and Amazon (AMZN) report after the close.

There are two important economic reports to note for Friday. The PCE Price Index is set to release at 8:30 a.m Eastern, and the University of Michigan’s UMich Consumer sentiment index at 10 am Eastern, which has caused intense algo moves during the session.

This week’s thesis unfolded perfectly. The S&P 500 (/ES) got through our zone at $3,820 and rallied to the 50-day simple moving average (SMA) at $3,887.

This week has been very volatile. Stay elite and play with profits. If /ES breaks $3,820, my first target is Point Of Control (POC) at $3,792. My second target is near our downside structure trendline and the daily 21 exponential moving average (EMA) around $3,763. If /ES continues to hold $3,820, see if it gets back to $3,887 and breaks through to $3,900 near our upside trendline.

After bad earnings this week, Google (GOOGL) has been an excellent compass for technology. If GOOGL can’t get above its previous low of the year at $94, expect a potential move lower toward $92 or $89.

Check out the video above to get the breakdown of my critical levels in GOOGL. We also discuss zones and major levels to watch on /ES and /NQ as they deal with trendline structures.

Interested in my strategy? Check out my recent webinar on how I’ve scalped consistently in this market.

Stay Focused!


Tech Earnings on Deck: META, AAPL, AMZN


This week’s big tech earnings reports like Microsoft (MSFT) and Google (GOOGL) have created a roller-coaster market. For the upcoming reports on Thursday, Shopify (SHOP) reports before the open, followed by Apple (AAPL) and Amazon (AMZN) reporting at the close.

Coming into the week, my thesis unfolded perfectly. The S&P 500 (/ES) rallied this week to the 50-day simple moving average (SMA) at $3,887.

In the video above, we’ll discuss key levels and major zones to watch on /ES. We also break down GOOGL levels after bad earnings.

If you are interested in my strategy, check out my most recent webinar on how I’ve scalped consistently in this market: https://www.youtube.com/watch?v=Yoy7B8Gd46A

Biggest Lineup of Earnings Season


This week is about big tech releasing earnings as we continue into earnings season.

On Tuesday, United Parcel Service (UPS) reports their Q3 earnings before the market opens, while Google (GOOGL) and Microsoft (MSFT) report after the close. On Wednesday, Boeing (BA) reports before the opening bell, and Meta Platforms Inc (META) reports after the close. Ending the week with the biggest names, SHOP reports before the open. To follow, AAPL and AMZN report after the close.

As for economic data this week, the US Manufacturing Purchasing Managers’ Index (PMI) will be released on Monday at 9:45 Eastern. The PCE Price Index is set to release on Friday at 8:30 a.m Eastern.

The last time the S&P 500 (/ES) approached the current zone around $3,792 to $3,820, /ES rolled over and placed a new low of the year. If /ES can’t hold $3,792 my first target is the daily 21 exponential moving average (EMA) at $3,734 near the downside structure. For upside potential, see if /ES holds its downside structure near $3,734. If so, /ES could break $3,820 and take out $3,843 above. My primary target is the 50-day simple moving average (SMA) at $3,887 near the bigger-picture downside structure.

Tesla (TSLA) released news on Monday that they cut prices in China, causing a 3% drop in the stock. See how Tesla continues to react to this news. TSLA bounced off $205; however, if it gets below $205, my first target is $202. My second target is $197. If TSLA rallies with the market, see if it can get through $211. From there, my first target is $215, and my second target is the Point Of Control (POC) at $221.

Check out the video above to get the breakdown of my top two setups in Netflix and Tesla. We also discuss key zones and major levels to watch on /ES as it deals with major structures.

Interested in my strategy? Check out my recent webinar on how I’ve scalped consistently in this market.

Stay Focused!


SPX Risk Management: Analyze Tab


We had great risk management on our SPX Put credit spread that was opened this week in the Compounding Growth Mastery. We also exited our Walmart (WMT) trade to protect capital on our call credit spread.

As for open trades in the Mastery, our LNG call debit spread looks about the same. We’ll discuss the risk management of our AAPL call credit spread ahead of it reporting earnings next week.

We also opened an iron condor on the SPX on Friday, betting that the SPX will open on Monday morning below $3,800 and above $3,595. We’ll dive into this trade deeper on the Analyze tab to review the risk management of the trade. We also have a similar plan on the SPY for those that have smaller accounts, which we’ll break down in the video above.

While we’re waiting for those larger swing opportunities (to hopefully short the rallies), we want to try and collect easy premium coming in. There’s a balance we want to consider between max loss versus max profit when trying to average 10% return per month.

We’ll review one of my trade ideas on NFLX as there are Big 3 buy signals on the lower time frames, it’s trading above the daily 21 EMA, and premium is getting pumped into the calls.

Stay Focused!


Recipe for Shorting the Market


Overall, the bigger picture structure has remained relatively the same. We’re continuing to build off of our game plan to short the rallies. In a perfect world, we want to short the market as close to the daily 50 simple moving average (SMA) as possible.


In the video above, we’ll review the recipe for a potential move back toward the daily 50 SMA:

  • SPX & QQQ: Two closes above the daily 21 EMA
  • VIX: Two closes under the daily 21 EMA
  • $DXY: Two closes under the daily 21 EMA
  • HYG: Two closes above the daily 21 EMA
  • Big 3 Buy and Sell Signals:
    • Cancellation of all lower timeframe Big 3 Sell signals (SPX + QQQ + IWM + HYG)
    • Lower timeframe Big 3 Buy signals (SPX + QQQ + HYG)

Overall the structure of the market hasn’t changed, as the SPX and QQQ have not had two official closes above the 21 EMA. This means that overall, the path of least resistance is in favor of the bears.

We can use our Big 3 buy and sell signals to determine when the structure on the lower time frames are changing from bearish to bullish.

We’ll also review charts of big names that reported this week like NFLX, TSLA, and SNAP. We’re patiently waiting for major companies to report earnings next week including AAPL, AMZN, and GOOGL.

In Sunday’s send, we’ll review our open and closed positions in the Compounding Growth Mastery and walk through potential setups for the week.

Stay Focused!


Market Sitting Near Major Zones


Our last report in focus this week is Snapchat (SNAP) reporting on Thursday after the close. As we head into Friday, take into account that it’s Options Expiration (OPEX). OPEX can cause extreme volatility. Expect options premium to get crushed, so choose strikes wisely.

At the start of this week, the S&P 500 (/ES) ran toward the daily 21 exponential moving average (EMA) at $3,724 and held upward structure. On Wednesday, /ES broke structure at $3,751 and fell to $3,693, the Point Of Control (POC).

After breaking structure, /ES has continued to stay in its current range between $3,693 and $3,724. With /ES being close to major zones during OPEX, see if /ES can break through toward the downside. My two main downside targets are $3,639 and our previous POC level of $3,604.

Use our downside structure, forming from our key levels of $3,776 and $3,751, as a roadmap into the end of the week.

My favorite setup after this week’s earnings is TSLA. As it continues to hold $203, see if it can bounce off $205 toward Thursday’s high of $215. If TSLA breaks $203 my major downside target is $197.

In the video above, we’ll discuss key zones and major levels to watch on /ES. We also discuss how TSLA can be a compass and/or a great setup to end the week.

Check out my most recent webinar on how I’ve scalped consistently in this market.

Stay Focused!


Q3 Earnings Set to Fire Up Market During OPEX


This earnings season, focus on the relationship between good or bad earnings and if they get rewarded or sold off.

Most importantly, if a company has good earnings, let’s see if they go higher… Such as Netflix #NFLX, who beat estimated earnings on Tuesday, creating a stellar move for Netflix as the S&P 500 (/ES) continued lower.

Be open-minded this week as the market is making large rallies and reversals during Options Expiration (OPEX).

In the video above, we’ll discuss key levels and major zones to watch on /ES. We also break down NFLX levels after earnings.

If you are interested in my strategy check out my most recent webinar on how I’ve scalped consistently in this market.