The market is in a waiting game, as traders anticipate which direction the market will move next.
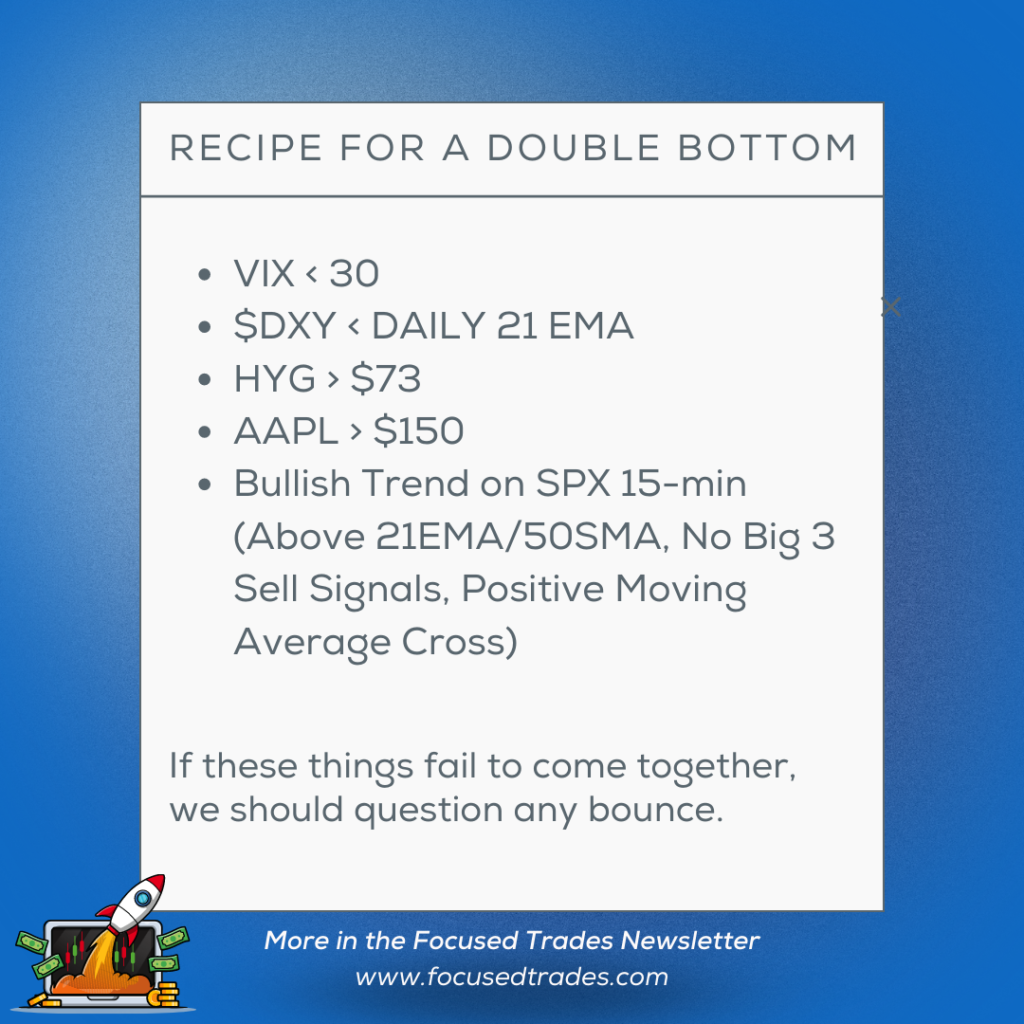
The market is at a spot where it’ll need to fight hard to change its structure to bullish. For any sustainable rally for the market, we’ll need to see the items in our “Double Bottom Recipe” come together.
For the market to rally, we’ll need to see the Dollar (DXY) break down. However, the DXY is above the 21 exponential moving average (EMA) and isn’t at a spot where it will likely break farther down. There are Big 3 buy signals on the daily and 4-hour chart, signalling a bullish trend for DXY. We’ll need to see DXY start to pull back on a day-to-day basis. The S&P 500 and QQQ could start to move higher once the DXY begins to head lower.
Any bounce in the market will be short-lived unless HYG gets above previous support around $73. Its structure is still bearish with daily, 4-hour, and 2-hour Big 3 sell signals.
Any downside in AAPL or TSLA could drag the rest of the market lower, considering they make up such a large portion of the S&P 500 index and QQQ index.
In the video above, we’ll review the recipe for a double bottom in the market, specifically the S&P 500 and QQQ. We’ll use TSLA and AAPL as examples of whether the market can hold support or not. If these names break through support, there’s a large gap to reach the June lows below.
Want to trade my A+ setups together? Join the Compounding Growth Mastery where I send real-time trade alerts, deliver daily market updates, and host live trading sessions. Start out with a 30-day trial and see what it’s all about!
To end the week, we have the PCE Price index on Friday at 8:30 a.m. Eastern. Keep in mind rebalancing as we enter the final week of the third quarter.
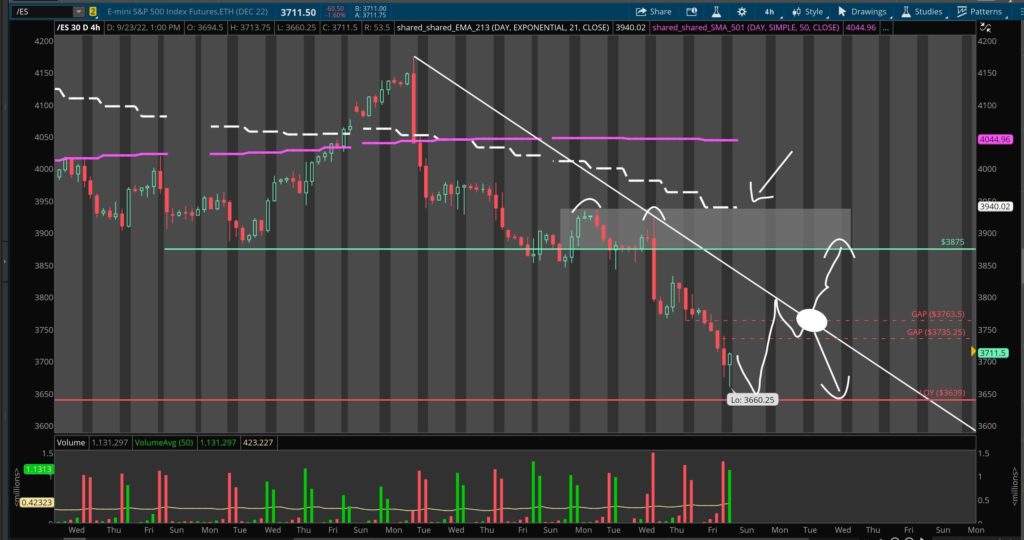
As we discussed earlier this week, the S&P 500 (/ES) continued to hold the low of the year at $3,639. On Thursday, /ES closed near the gap fill from $3,735 to $3,763. With /ES above structure, see if it can rip through $3,763 and head toward our first target of $3,807. If /ES continues higher, our main target is point of control (POC) at $3,875.
If /ES holds $3,735 and fills the gap, my first target will be the structure below around $3,702. If /ES breaks below this structure, my next target is the previous low of the year at $3,639. My main downside target is the new low of the year at $3,613.
Pay attention to the Volatility Index (VIX) as it approaches a major resistance zone from $35 to $37.5. As /ES moves lower, VIX can provide additional confirmation for a short entry.
My main focus to end the week continues to be SPX. Watch the video above to see which key levels and structure I’m noting on /ES.
Tune in to trade SPX and other potential opportunities in the market with me live in the Simpler Day Trading room, try a one-week trial!
Hey Focused family! I’m traveling back from Taylor’s wedding and unable to make a video, so I am providing my market prep below.
/ES 4-Hour Chart
On Friday, the S&P 500 (/ES) almost hit the low of the year at $3,639 and ended the week with a strong cover pop. Be mindful of potential rebalancing as we enter the final week of the third quarter.
This week, Federal Reserve Chairman Jerome Powell is speaking on Tuesday at 7:30a.m. Eastern and Wednesday at 10:15a.m. Eastern. Powell is followed by jobless claims on Thursday and the PCE Price index on Friday, both at 8:30a.m. Eastern.
Pay attention to the short-term downside structure near the gap fill on /ES from $3,735 to $3,763.
If /ES can hold $3,639 my first target is to fill the gap from $3,735 to $3,763. If /ES breaks through $3,763 my second target is a reset to point of control (POC) at $3,875.
See if /ES fails at $3,763, as my next target will be the low of year at $3,639. If /ES continues lower my next target is $3,596.
Join me live in the Simpler Day Trading room and try a one-week trial. Tune in to trade even more of my setups, as well as look for more potential opportunities in the market.
There’s nothing a bear loves more than shorting a bounce that quickly leads to a reversal into new lows. For many (myself included), that is the game plan for swing trades in a downtrend: get short on the reversions to the mean.
While this is certainly a strategy that has merit, there’s always one thing the bears fear most looming in the distance: the short squeeze.
When the market reaches oversold readings and too many market participants are leaning short, the potential for a short-squeeze is always around the corner. In fact, you’ll see some of the biggest/rapid moves to the upside in a downtrend, all as a result of the market trapping shorts and squeezing them.
For those who have been short during a short squeeze, we know it can be an unpleasant experience. While it can be uncomfortable taking heat against our open positions, there’s a few adjustments you can make to put yourself (and your shorts) in a position to remain comfortable.
Here are my tips for handling “the short squeeze heat”
Get short into bounces, NOT when the market is deeply oversold. I look to get short near the daily 21 exponential moving average (EMA).
Give your trades more time time till expiration. While short squeezes can be violent, they tend to be short-lived. Giving your trade more time till expiration will make it easier to sit through those rips.
Sell call credit spreads. Selling out-of-the-money credit spreads with 30 to 60 days till expiration is a great way to get positioned for a bigger picture move lower, while still being able to sit through the ebbs and flows. So long as the market closes under your short strike at expiration, there’s a paycheck with your name on it.
So don’t fear the short squeeze! Instead, make adjustments that put you in a better position to stay confident in your trades during large bounces.
There are 3 things that need to come together to match the criteria of my favorite options trading setup. Since taking trades with this strategy, I’ve been able to uphold an 80%+ win rate in a “messy” to say the least market environment. The alerts for these trades were sent to members of the Compounding Growth Mastery and/or the Simpler Central room.
As we walk through this simple 3-step checklist, we’ll review the tools and settings needed on your trading charts. There are a few simple tools that you will need to execute this strategy.
UPDATE: Big 3 Heat Map
I put together a “Big 3 Heat Map” that helps us confirm signals across multiple timeframes at a glance. While I can’t share the proprietary Big 3 Heat Map, I created a free “Moving Average Heat Map” for our subscribers that might not have the Big 3 indicators.
Daily 21 Exponential Moving Average (EMA) a.k.a. “Daily Mean”
The daily 21 exponential moving average (EMA) is vital as this will act as our entry point (and the first step of our checklist).
First we’ll need to review the concept of reversion to the mean: understanding that stocks generally make a move from the daily 21 EMA and typically make 2 average true range (ATR) moves away from there. As the stock approaches 2+ ATR, there is a growing probability that it will revert back to the 21 EMA.
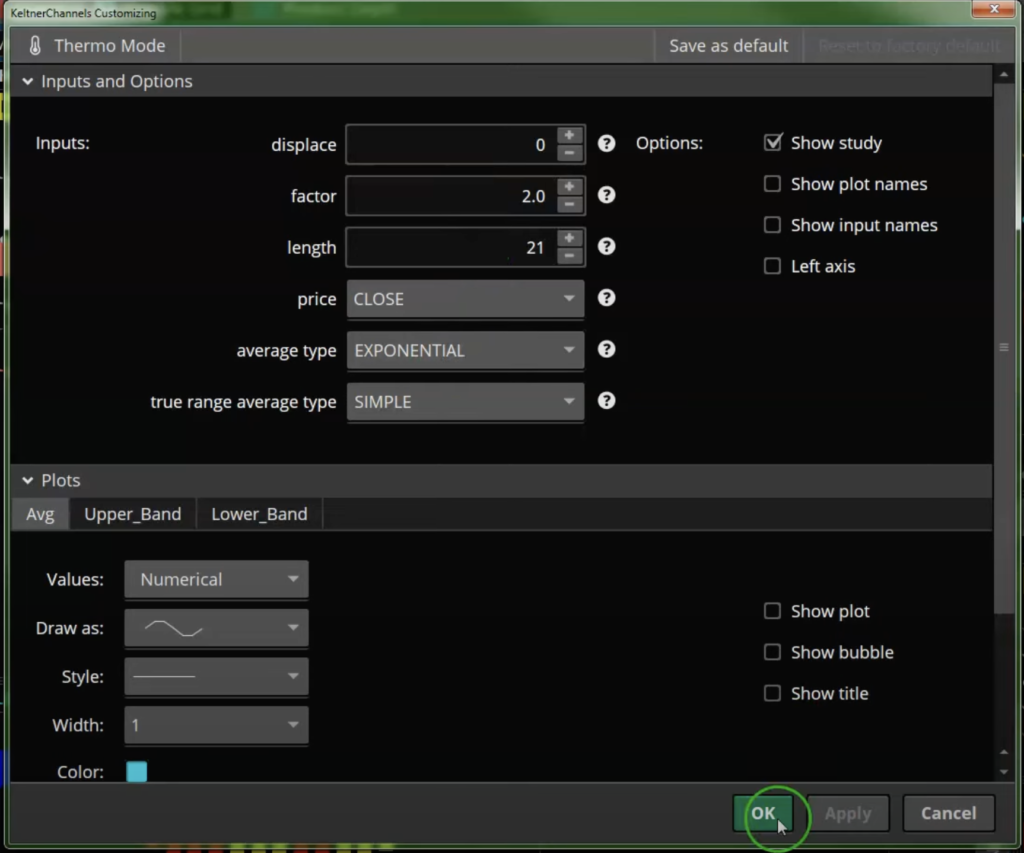
Below you’ll find the settings for adding the 21 EMA:
Keltner Channels
We’ll need to add keltner channels to our charts to measure average true range moves above the 21 EMA.
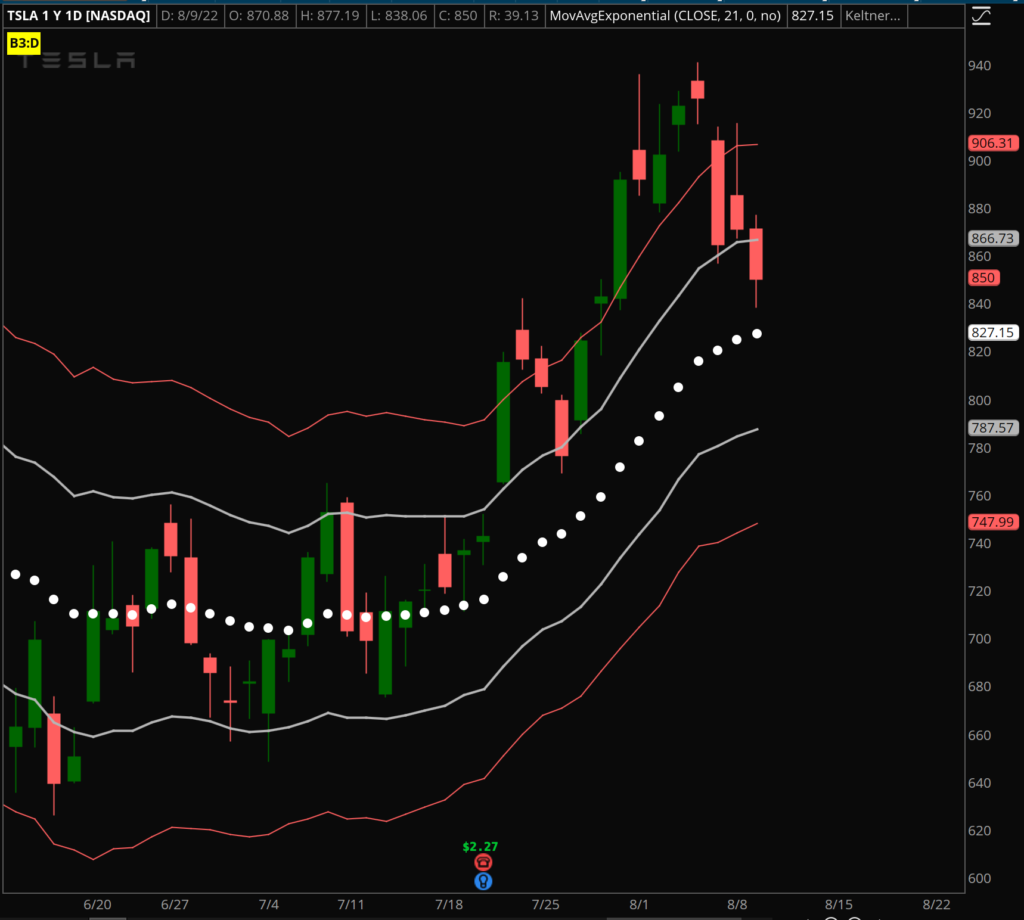
Note in the screenshot below that the grey lines are 1+/- ATR moves away from the 21 EMA, and the red lines are 2+/- ATR moves away from the mean.
Keep in mind that you can adjust the colors of the lines by clicking on the “Upper_Band’ and “Lower_Band” tabs.
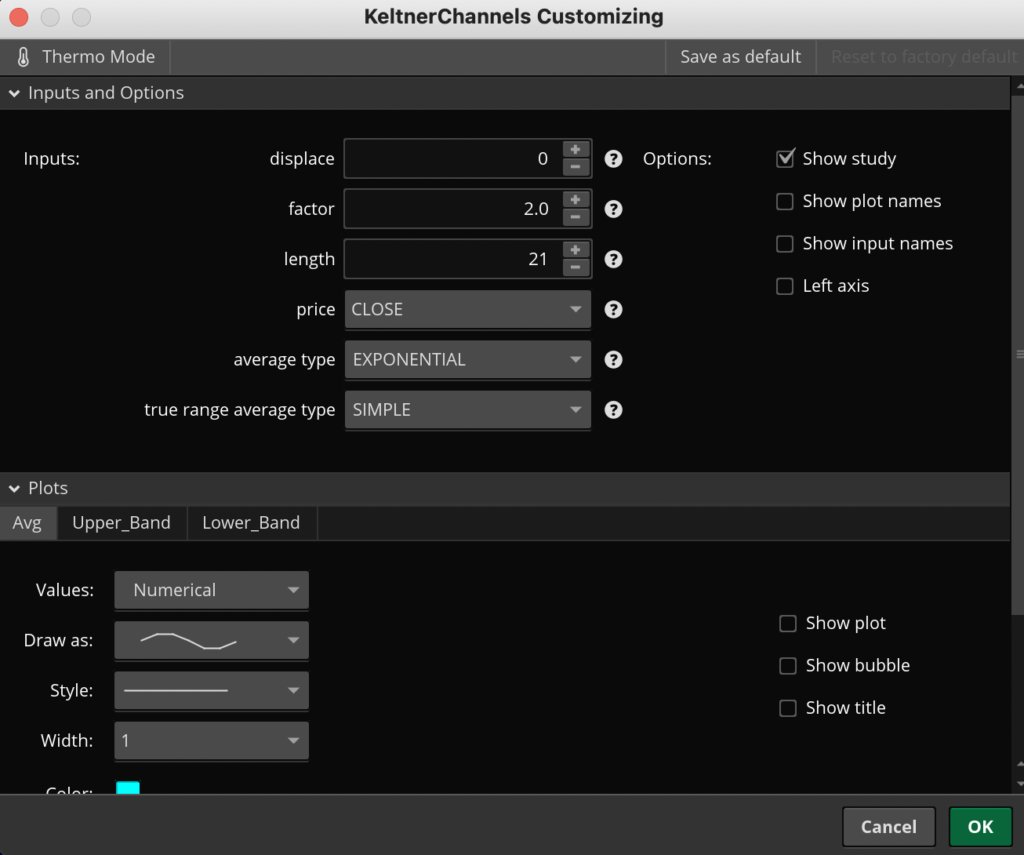
Keltner Channel Settings 1 ATR
Keltner Channel Settings 2 ATR
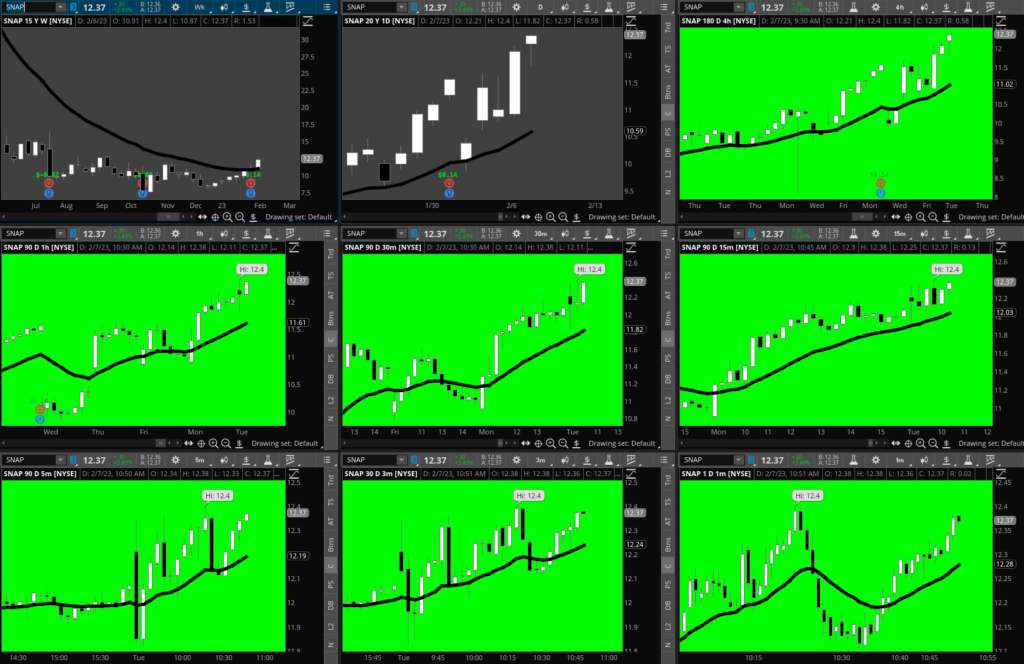
Now that you have the 21 EMA and keltner channel extensions added to our charts, you can look at stocks and see how price will move from the daily 21 EMA, head toward 2+/- ATR, and revert back to the mean.
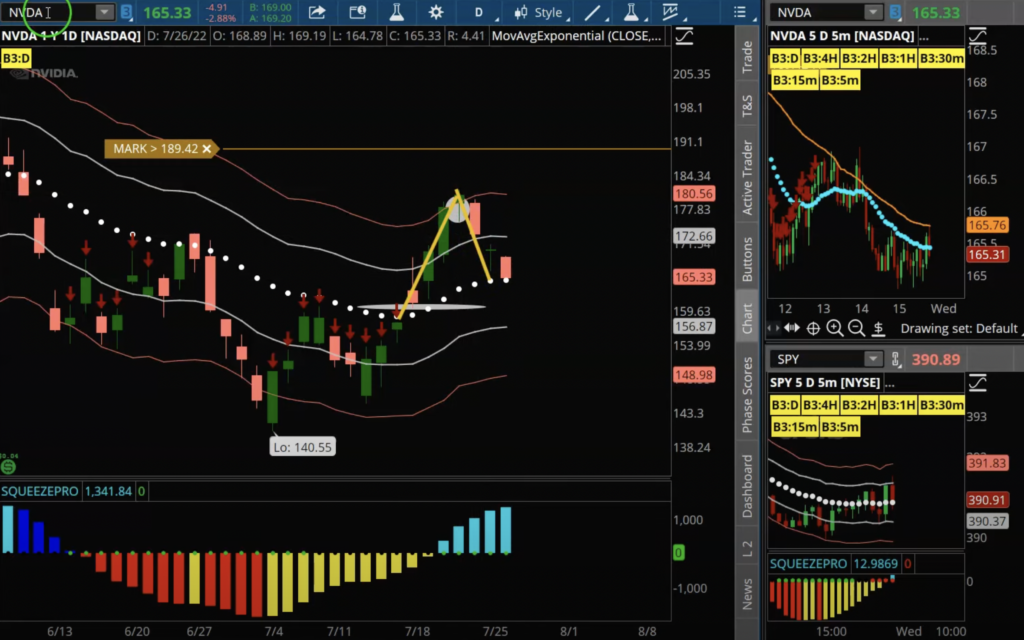
Take a look at an example of this on NVDA below.
NVDA Reversion to the Mean on Daily Chart
Our goal is to catch the push from the daily 21 EMA to 2+ ATR. Think of the daily 21 EMA as our “launching pad.”
Big 3 Indicator
The next tool you’ll need to execute this strategy is the Big 3 Buy and Sell Signals indicator. This innovative indicator combines a number of factors that measure trend, structure, and momentum to guage the path of least resistance.
The Big 3 indicator helps signal when a setup is bullish or bearish, when and where to get long or short, and when to GTFO (Get The Funds Out). With the proper tools, we should be able to gauge whether a setup is worth our time (for longs or shorts) in a split second.
If we’re wanting to get long, we’ll look for Big 3 buy signals (a green arrow) on lower timeframes, whether that be a 15-min or 30-min chart, etc. We are finding the moment in time where trend, structure, and momentum come together to trigger a lower time frame Big 3 buy signal. This serves as our entry signal that takes us to +2 ATR on the daily chart.
As a big fan of the squeeze, I modified the original squeeze with the Big 3 Signals and created my Big 3 Squeeze. The Big 3 Squeeze helps answer the common question with the squeeze, “Which direction is the squeeze going to fire?”.
The Big 3 squeeze’s histogram labels show us when a setup is considered A+ for a possible entry. And with the help of the Bull and Bear score labels, we can see which direction the setup favors, the bears or the bulls.
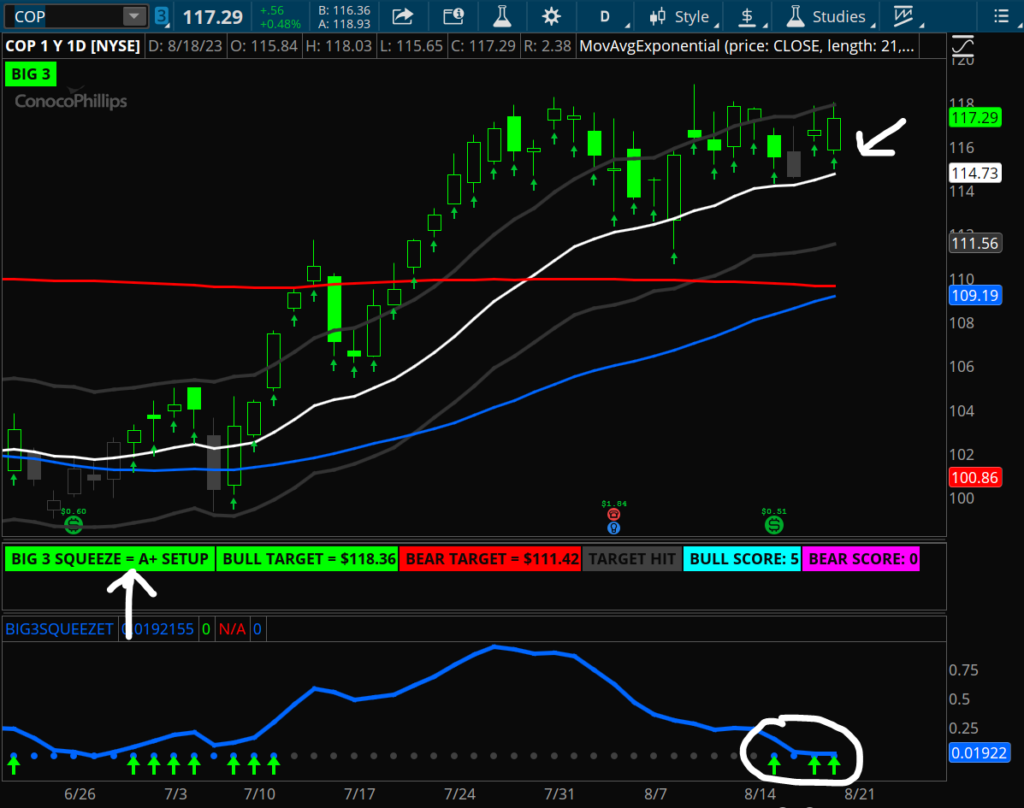
You’ll see on the COP screenshot below how the Big 3 Squeeze works. The histogram will turn green for an A+ Setup, this means it’s hitting my criteria for what I think is an A+ trade. The bull score label is at 5, which is the best number, and the Big 3 is giving us a green buy arrow plus green arrows on the histogram. This makes for the perfect opportunity to go long.
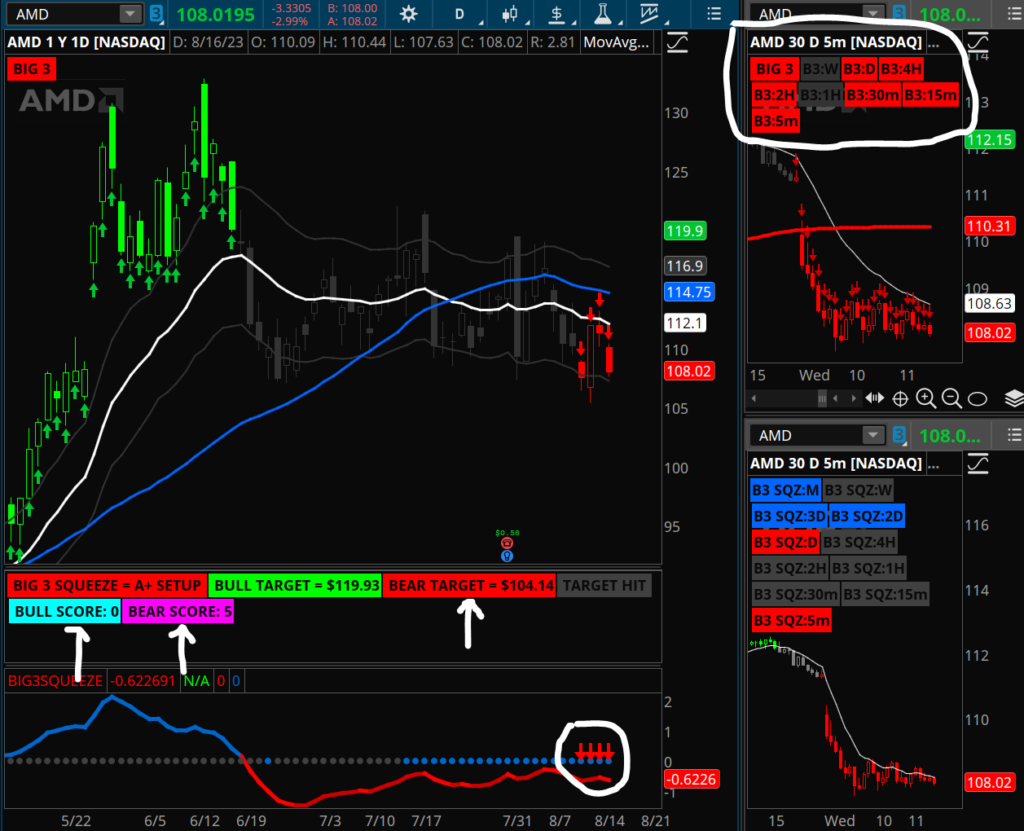
I bought a put debit spread looking for the daily bear squeeze to fire shortly into $104ish. In this example, the Bear Score label showed a 5, which is the highest number for the histogram, meaning a good short could happen. It also had multiple squeeze labels red on multiple time frames, indicating a possible move lower. On top of everything else, the Big 3 Squeeze A+ Setup label being red and red arrows on the histogram, this was the perfect setup to head lower on AMD.
Step 1: Find a stock trading right above the daily 21 EMA.
Step 2: Find Big 3 buy signals on lower time frames.
Step 3: Match those lower time frame buy signals with lower time frame squeezes.
Tips before you go:
Do not get long below the Daily 21 EMA.
Look for lower timeframes to change from neutral to bullish Big 3 signals (yellow to green).
The goal is to get an entry as early as possible once the signals pop up.
The same principles apply to the downside, just flipped.
I hope you’ve enjoyed this break down of how to apply the Big 3 indicator to one of our favorite options trading strategies. If you have any questions, reach out to our awesome support staff at [email protected] or 512-266-8659.
Certain trading events happen every quarter. As traders, it is our job to understand what these events are, how they impact the market, and how we as traders (especially shorter-term traders) need to change our game plan, mindset, and execution based on these events.
One major event is Options Expiration (OPEX). During OPEX weeks, option-open interest reduces as near-term options approach expiration and then expire. OPEX is one week before options are set to expire, the Friday before every third Saturday each month. OPEX weeks are usually extremely volatile. Expect options premium to get crushed, so choose strikes wisely.
Our next major event is SPX Roll. Find the dates of this event on the CME Group website. SPX Roll occurs every quarter. Big money has to roll out to further expiration because the options futures contracts and the context they are playing are set to expire. This creates large pops and drops in price action in the market.
Another event is Quad Witching, which happens on the third Friday of March, June, September, and December. Quad Witching is when market index futures, market index options, and stock optionsexpire once every quarter. Quad Witching can create false signals, traps, and premium crushing on options. In turn, this leads the market to liquidity.
The last event we will cover is Rebalancing. This is when large funds readjust their portfolio to match their risk tolerance and stick to their investment plans. Rebalancing includes the buying and selling of portfolio assets to help balance risk. This creates large pops and drops in the market, leading to more trade opportunities.
Trade live with me in the Day Trading Roomand take advantage of potential opportunities when the market is making large moves.
We’re waiting for Big 3 sell signals to appear on the S&P 500 (SPY) as it has a negative moving average crossover, with the daily 21 exponential moving average (EMA) below the 50 simple moving average (SMA).
The Russel ETF (IWM) has a negative MA cross but was able to hold support on Friday.
The semiconductor sector (SMH) has both a negative moving average crossover and daily Big 3 sell signals, taking out recent support last week. This points toward the market gearing up for a move toward the June lows.
HYG has negative Big 3 sell signals, indicating the market will likely head lower. The DXY has a daily squeeze looking poised for a breakout, which would ultimately send the market lower as well.
Keep in mind on Wednesday we have the FOMC statement, where Federal Reserve Chairman Jerome Powell will give a Fed update.
The market will likely head toward the June lows, but we could see a bounce.
Price on the SPY daily chart is at -3 average true range (ATR) moves and is very oversold on the SPY hourly chart. This means there is a potential for an oversold bounce. Ultimately, if SPY can’t find support at the $390 level, the market will roll over to the June lows.
In the video above, we’ll review potential trade ideas we’ll look to enter in the coming weeks, the conditions on various sectors, and our recently closed positions and bigger-picture account growth in the Compounding Growth Mastery.
The S&P 500 (SPY) gapped down below a key level of support at $390. Now, we’re looking for the market to take out the June and July lows.
The Nasdaq (QQQ) took out the $290 level and is heading toward the June lows.
This gap lower dragged big names lower like AMZN, GOOGL, AAPL, and TSLA, which is important as these names have a large weight in the overall market.
We’re seeing negative moving average crosses that we’ve been discussing as of late. This occurs when the 21 exponential moving average (EMA) crosses below the 50 simple moving average (SMA).
For example, the QQQ daily chart is showing a negative moving average crossover with bearish Big 3 sell signals from the daily chart down to the 5-min chart.
The SPY daily chart doesn’t have a Big 3 sell signal yet, but there is a fresh negative moving average cross.
What appears unlikely at this point is if the market can save itself from here.
The market is oversold so there could be a bounce toward previous support, but we highly doubt it’ll be followed by a bullish trend to the upside. Most likely, any bounce will be a short squeeze.
Want to trade my A+ setups together? Join the Compounding Growth Mastery where I send real-time trade alerts, deliver daily market updates, and host live trading sessions. Start out with a 30-day trial and see what it’s all about!
This stacked week of catalysts isn’t over yet. There were multiple reports released this week including the Consumer Price Index (CPI) report on Tuesday, the Producer Price Index (PPI) report on Wednesday, and Initial Jobless claims on Thursday.
Heading into Friday, we are still dealing with market events from earlier this week. SPX Roll, SPX rebalancing, and Triple Witching end on Friday.
The S&P 500 (/ES) hit the top of the zone at $4,167 on Tuesday. After the CPI report, /ES had a major drop to $3,930. With /ES at a major structure and market events to end the week, we want to be cautious on Friday.
If /ES stays under $3,930, my first target is $3,900. My second target is $3,878. Although I’m not currently bullish, we want to stay open-minded. If /ES gets above $3,930 and breaks structure, my next target will be $3,955.
My main focus this week is trading SPX. Watch the video above to see which key levels and structure I’m noting /ES.
Join me live in the Simpler Day Trading room and try a one-week trial. Tune in to trade even more of my setups, as well as look for more potential opportunities in the market.