focused-trades-logo-w-taylor
focused-trades-logo-MOBILE

Bullish Monthly Squeeze Watchlist


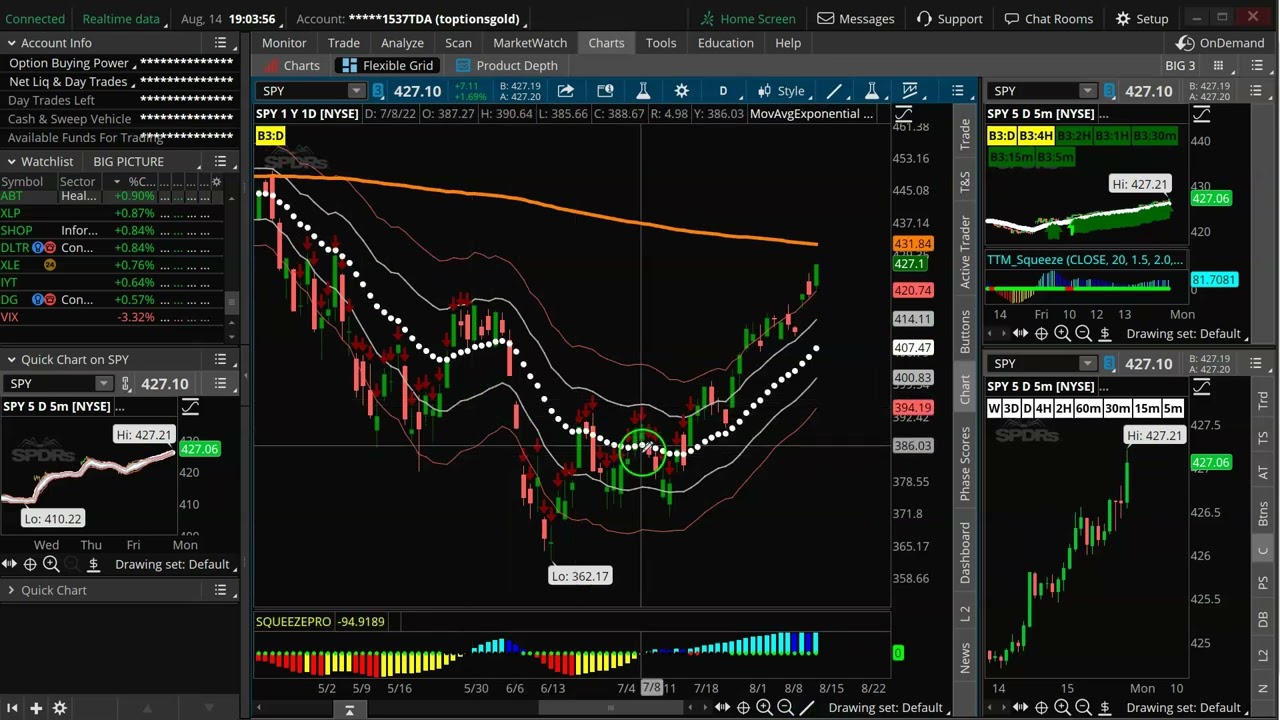
We’re finally starting to see signs of exhaustion in the market over the last few days. The market has made a big push with uninterrupted upside momentum for the last 4 weeks.

Now that names are trading at 2+ average true ranges (ATR) with Big 3 buy signals turning neutral, the probabilities suggest a flush to the 21 exponential moving average (EMA).

If the S&P 500 finds support after a flush to its 21 EMA, we’ll look for Big 3 buy signals. Seeing Big 3 buy signals on the lower timeframes like the 1-hour, 30-min, and 15-min charts could trigger the next leg to the upside.

If we continue to flush past the 21 EMA, we’ll have to ignore the idea of looking for bullish trades.

If we can hold support and see the “pretty green colors” on the Big 3 indicator, we’ll look for bullish trades for a push toward these recent highs.

In the video above, we’ll review our watchlist including our number one name on our “buy the dip” watchlist. The AAPL monthly chart is bullish so we could see a push toward new all-time highs. It also has a monthly squeeze with bullish trend, structure, and momentum. 

We’ll review names like TSLA, AMZN, XLE, and SMH that would have great buying opportunities on a dip and review our recent trades taken in the Compounding Growth Mastery.

Stay Focused!


Pullback to Daily Mean?


We’ve seen a strong market over the last few weeks, which has made for some good trades in the Compounding Growth Mastery. The market is now trading at 2+ average true ranges (ATR) above the daily mean. We are seeing signs of exhaustion, meaning that we are no longer seeing buy signals on the Big 3 indicator.

These lower timeframe buy signals can trigger a push to the 21 exponential moving average (EMA). When the Big 3 indicator transitions from bullish to neutral on the 30-min, 2-hr, and other lower timeframes, there is a growing probability that names will drop back to the 21 EMA. 

Both the Nasdaq (QQQ) and S&P 500 (SPX) are down slightly on Friday, showing signs of exhaustion, and appear ready for a push back to the 21 EMA.

The market hasn’t traded at the daily 21 EMA in about a month. Now that the buy signals have gone away, it’s a sign that the bulls are running out of gas.

The big question now is if we see names in the financial and technology sectors finally pull back to the 21 EMA.

In the video above, we’ll review what we’re looking for in the event we see a pullback to the 21 EMA. 

Stay Focused!


Rangebound Week, End of OPEX


With Options Expiration (OPEX) on Friday, the S&P 500 (/ES) is nearing major downside structure. 

For the next few sessions, watch the daily structure of the market. If /ES tops out at its daily trendline, it could pull back and reset. Or /ES could break through the trendline and accelerate towards $4,500.

OPEX is approaching on Friday which can cause major chop and consolidation. In these times, we want to pay attention to the key levels that /ES will chop at. Point of Control (POC) is sitting at $4,272, and /ES has another key level above at $4,320, the 200-day simple.

If /ES breaks its high of the day from Thursday at $4,292, it could break through $4303 and head towards $4,272. However, if it rolls off $4,292 and breaks $4,272 my downside target is $4,260. 

Top on my focus list is AMZN, which has been struggling at its 200-day simple at $145. Look to short AMZN if it struggles at $142 towards downside structure at $140.

I’ll be live in the Simpler Day Trading room this week. Tune in to trade this and other potential setups with me live and navigate the market during OPEX.


Stay Focused!


FOMC Done OPEX Next | Focused Trades


With the Federal Open Market Committee (FOMC) event finally behind us, Options Expiration (OPEX) is next on Friday. In the video above, I’ll dive into what to expect with OPEX coming up and how it can affect /ES and introduce potential setups on our watchlist, including SHOP, AMZN, TSLA, and ROKU. I’ll be live in the Simpler Day Trading room this week. Tune in to trade these setups with me live and look for more potential opportunities in the market. Stay Focused!

Stacked Bullish Signals


There are three big names that we’re looking to take entries on as soon as all of our big 3 criteria is met and we’re trading back at the daily 21 exponential moving average (EMA).

The number one name we’re looking to buy on a dip is AAPL. AAPL hasn’t had a daliy buy signal since February, and now it is printing bullish, stacked Big 3 buy signals on the daily chart. It is extended, therefore we will be waiting to take an entry until we see a flush.

Our ideal entry is around $160 near the daily 21 EMA and daily 200 simple moving average (SMA). As far as trend, structure, and momentum goes, the monthly, weekly, daily, 4-hour, and down to the 5-minute charts have improved.

Get Taylor’s trade alerts sent right to your phone with the Compounding Growth Mastery! We’d love to have you join for a trial. In the video above, we’ll review the 3 big names and setups we’re looking to buy on a dip using our Big 3 buy signals.

Stay Focused!


Extended, Not Slowing Down Yet


The market is currently overbought. The major things we want to look for are signs of exhaustion.

Once the market hits 2+ average true range (ATR) moves above the daily 21 exponential moving average, it could still push toward 3+, 4+, or 5+ ATR. The major signs of exhaustion are when the lower timeframes begin to switch from bullish to neutral.

At this point, the S&P 500 (/ES) is trading above the daily 21 EMA. We want to focus on the structure below the surface. We know the market is extended, but how far will it go?

The S&P 500 (/ES) has a 2-hour squeeze with Big 3 buy signals. Trend, structure, and momentum on the 2-hour, 1-hour, and 30-min time frames show that the path of least resistance is still to the upside.

We’d love to see a flush, potentially to $4,150, to get better entries for swing trades. For now we’re looking to see how far the market can go. We could see a push toward the 200 simple moving average (SMA) and make a run to $4,300.

The market is extended, but it’s not showing signs of slowing down just yet. 

Get Taylor’s trade alerts sent right to your phone with the Compounding Growth Mastery! We’d love to have you join for a trial. In this Sunday’s watchlist video, we’ll review trades we’re looking to buy on a dip including AAPL, TSLA, and NVDA.

Stay Focused!


Profit Taking After CPI


After consolidating into Core Consumer Price Index (CPI) on Wednesday, the S&P 500 (/ES) broke out to higher levels. Let’s see if it can hold.


Market Overview

If /ES does hold $4,212, it could work its way back up to $4,260. The next target will be the 200-day simple moving average (SMA) at $4,329. If /ES fails at $4,212, it may pull back to either $4,189 or Point of Control (POC) at $4,136.

Exploding into CPI news on Wednesday, the Nasdaq-100 futures (/NQ) dropped to its Point of Control (POC) at $13,271. If /NQ continues to pop on Friday toward $13,356, it could fall, break $13,271, and possibly drop to $13,150.

Continue to pay attention to the relationship between the Volatility Index (VIX) and /ES for a potential pullback as VIX holds $20. 


Potential Setups

Many setups have unfolded, one of them being COIN. After its rally on earnings Wednesday, it dropped back to $85. See if it can find its feet, pop toward $88, and fail down toward $79. 

SHOP finally broke through its zone above $42, and then dropped back under the zone to $39. If it breaks $40, our next target is our prior CPI top of the zone at $38.


I’ll be live in the Simpler Day Trading room this week. Tune in to trade these setups with me live and look for more potential opportunities in the market.

Stay Focused!