Happy Monday, traders! Back to work! Friday’s wild close opened the door for a *potential* short-squeeze, and while it’s a bounce we’d want to short, there’s a few cheap trades to consider for playing the bounce. Let’s take a look!

Happy Monday, traders! Back to work! Friday’s wild close opened the door for a *potential* short-squeeze, and while it’s a bounce we’d want to short, there’s a few cheap trades to consider for playing the bounce. Let’s take a look!
The next major catalyst we’re focusing on is the Consumer Price Index (CPI) report released at 8:30 a.m. Eastern on Friday. Pay attention to this report as it gives insight into inflation and how much consumers are spending.
The market rolled over on Thursday ahead of the CPI report. We’ll see if this report pops the market back into its range or drops it further.
Depending on what happens with the CPI report, we’ll wait for the Federal Open Market Committee (FOMC) statement by Federal Chairman Jerome Powell at 2:00 p.m. Eastern on Wednesday, June 15th.
We’re continuing to focus on the structure of the S&P 500 (/ES) daily chart to the downside.

On Thursday, the /ES hit this structure and broke through major inflection points. The /ES dropped to close the day on the point of control (POC) at $4,013.50 and below the 4-hour Ichimoku Cloud.
In the video above, we’ll break down where the market could further break out of its range, define key levels on the major indexes and Volatility Index (VIX), and review our focused list setups on SHOP and AAPL.
Stay Focused!
After a short week last week, our focus is on structure.
The S&P 500 (/ES) is trading below its trendline structure, which leads us to lean more bearish. On Monday, the /ES gapped up and failed to key levels.
The major catalyst this week is the Consumer Price Index (CPI) report released on Friday. We’ll follow up in the Thursday newsletter to hone in on how this inflation report can affect price action.
We’re also watching two specific events on SHOP and AMD.
On Tuesday, the SHOP 10:1 stock split voting will occur. On Wednesday, AMD has a financial analyst day, which could impact price.
In the video above, we’ll review the new liquidity levels on /ES, lay out key zones and structures, and walk through our favorite setups that we’re keeping an eye on.

Here is our focused list:
SHOP — There is a large flag forming. Be patient for the stock split news as this will be a large catalyst, up or down. If SHOP works its way up to $383 and the daily 21 EMA, this could be a short opportunity. If SHOP moves through $383, we can look for it to move to the trendline structure. The same goes for the downside. If SHOP breaks $383 and moves lower, we can look for it to break to the trendline and either pop back or drop lower.
AMZN — This is the first week since the 20:1 stock split. Practice patience and observe the options premium. AMZN has a big gap to fill from $130 to $140. If AMZN continues to fail at its key zone and reverses, we’ll look for a short to the $121 range with the daily mean near $118.
AAPL — If AAPL pops toward $148 and above the daily mean, we could look to short it. Note that POC is at $145.44. If AAPL fails and drops, see if it breaks structure and heads toward the $140 range. If AAPL holds POC, AAPL could pop to $152 to $154.
Stay Focused!
Options traders must be aware of quarterly expiration on Thursday, June 30th. There are similar structures on the S&P 500 (SPX) between this week’s structure and the structure in March 2022 (the previous quarterly expiration).
We’ll observe the short-term and long-term structure and price movement we could expect heading into the rest of the year.
In the video above, we’ll lay out potential plays on SPX and review names on our watchlist including XLE, XOM, CHK, and more.
Stay Focused!
As options traders, there are certain expiration dates we want to be mindful of. Bigger than them all are quarterly expirations.
The next quarterly expiration series is on Thursday, June 30th. We’re seeing similarities between the current market and the structure in March 2022 (the previous quarterly expiration).
The overall structure of the market remains bearish. We don’t see that changing anytime soon.
What we’re discussing here is “short-term thinking”.
Looking at the chart of the SPY futures below, you’ll notice a similar pattern to what we saw back in March:
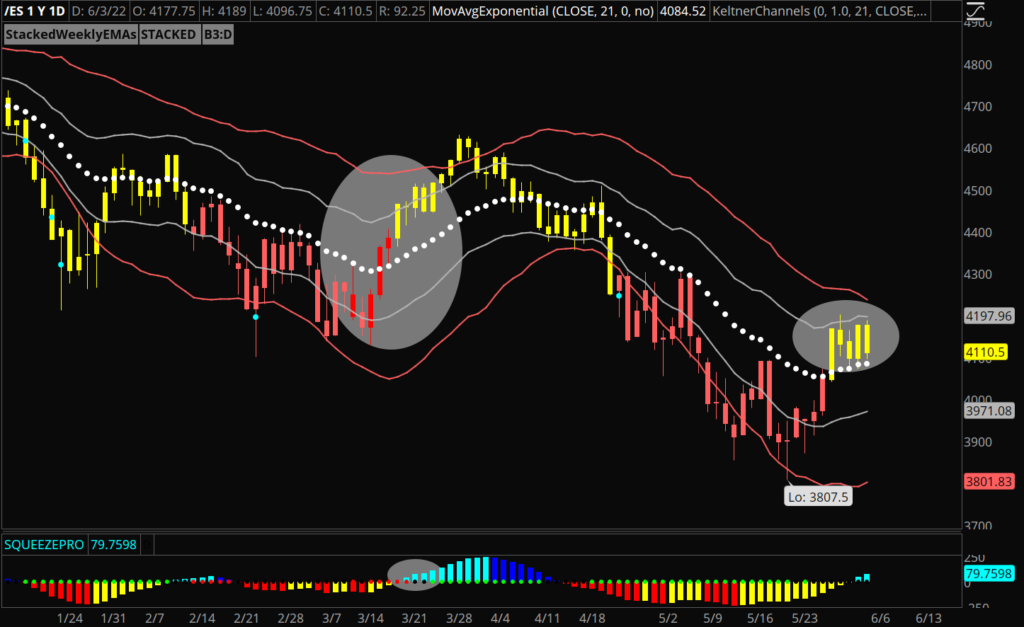
This doesn’t mean the market is suddenly bullish. Nor does it mean the market doesn’t roll over from here. This potentially suggests the market is positioned to crush shorts into quarterly expiration, just like it did in March. If this is the outcome, we’ll have a 2- to 3-week window to take advantage of the “put destruction” by pursuing long positions or credit spreads on SPX.
If we see a close back under the daily 21 EMA, the chances of any short squeeze from here are slim.
Another suggestion: Consider opening a few deep out-of-the-money (OTM) iron condors. This week, we sold an iron condor on SPX for the quarterly expiration. We sold calls and puts 9% above/below the current price. These iron condors make for great “income-producing” trades while we wait for clarity regarding the next directional move.
Stay Focused!
The final catalyst for the week is the Nonfarm Payroll (NFP) job report set to report pre-market on Friday.
The market worked its way back to the daily mean at the 21 exponential moving average (EMA) and rallied to the high of the week on Thursday.
If the S&P 500 (/ES) breaks above the trendline near $4,212 to $4,220, look for it to reach the 50-day simple moving average (SMA) and $4300.
Follow the market and target structure. In the video above, we’ll review the price action of the major indexes and volatility and review setups on NVDA, SHOP, and APPL.
Stay Focused!