focused-trades-logo-w-taylor
focused-trades-logo-MOBILE

Market Breaks Structure, End of Q2


The end of the second quarter is here. We want to focus on the rebalancing that can happen. As discussed earlier in the week, a nice roadmap has unfolded for us.

We started the week with a double top. The S&P 500 (/ES) broke under our major zone, leading us back below the mean at $3,880. This led the /ES toward the structure from our prior low of the year at $3,807.50.

There was consolidation heading into Thursday’s session. The /ES had a gap down after-hours, bringing the /ES back to point of control (POC) at $3,774. The /ES popped back to the low of the year at $3,855.

Thursday, June 30th marks the last day of the quarter and also rebalancing. This could be part of the reason for the /ES pop on Thursday. 

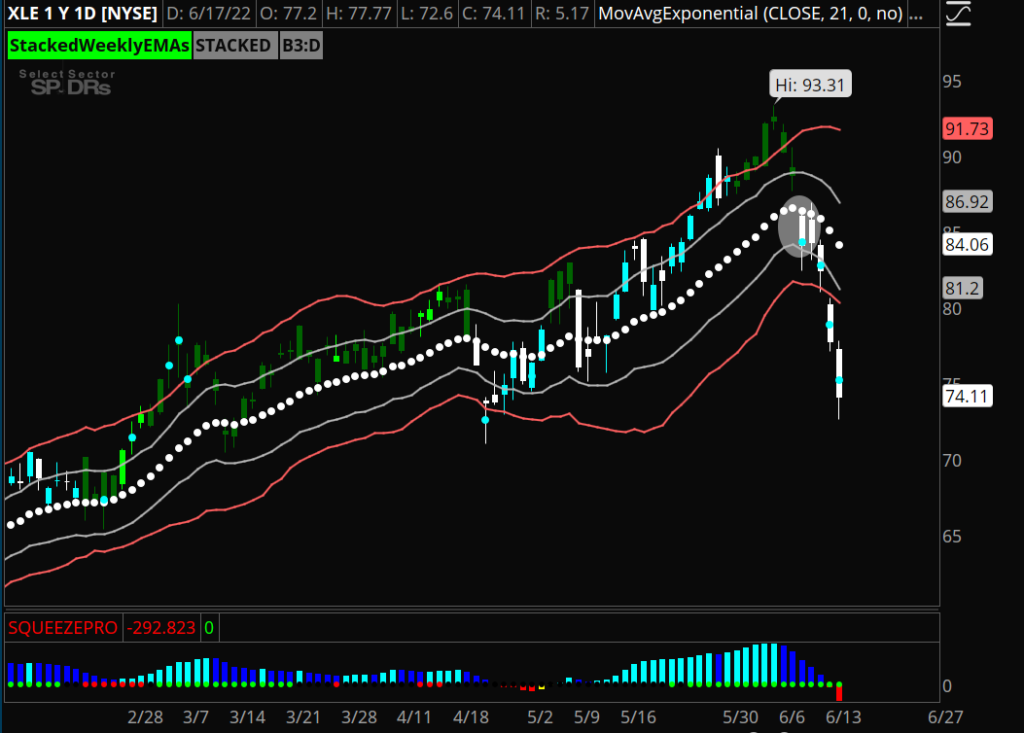
The /ES is under the daily 21 exponential moving average (EMA) and a big structure. If the market pops after rebalancing but doesn’t break above this structure, there’s a lot of work left to do.

If the S&P 500 (/ES) struggles to get above $3,800, look for it to head back to POC, the low of the year, and our next key level of $3,720. If the /ES holds $3,800, see if it can hit the top of our zone at $3,855.

We’ll also continue to observe structure for a potential double top.


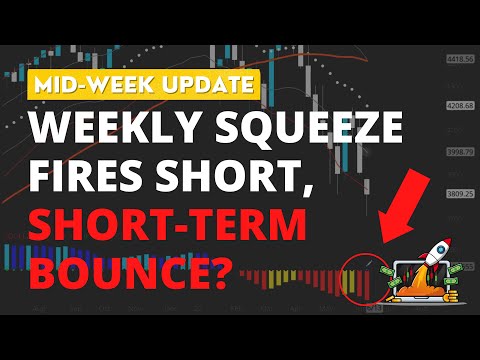
In the video above, we’ll break down where the market could head after rebalancing, define key zones in the Volatility Index (VIX), break down the structure of the S&P 500 (/ES), and review our focused list setups on NVDA and AAPL.

Stay Focused!


Reset for Market: Big Moment Ahead


The market made the perfect reset on Monday for the chance to make a big move next.

The S&P 500 (/ES) hit the low of the year at $3,639 and bottomed. On Monday, we saw a cover pop to the daily 21 exponential moving average (EMA).

On Tuesday morning, SHOP will have their 10-1 stock split, which we’ll review in our focused list in the video above.

On Wednesday, June 29 at 9:00 a.m. Eastern, Federal Reserve Chairman Jerome Powell will speak on the Economic Policy Panel Discussion at the ECB Forum on Central Banking.

Keep in mind we are heading toward the end of June, which also means we’re approaching quarter-end rebalancing. Next week will also be a shortened holiday week, as the market will be closed on Monday, July 4th.

On Monday, /ES ended the day at the daily mean (21 EMA) at $3,900. If /ES holds $3,900 and breaks through the high of the week at $3,948, expect the market to move toward its upper zone and trendline structure (as discussed in the video above).

If /ES breaks $3,900, look for a drop to the key zone at $3,855. After that, there’s potential to hit its prior low of the year at $3,800.

Here is our focused list:

NVDA — Broke below its 21 EMA at $172 on Monday. If NVDA can’t break above $170, it could drop to the support structure below near $164 to $163 down to point of control (POC) at $158. If NVDA reverses along with the rest of the market, see if it can hold its 21 EMA, break $174, and fill the gap from $176 to $180. 

SHOP — Practice patience after the stock split Tuesday morning. See if SHOP can move toward $383 and fail for a short opportunity to $355. If SHOP drops to $355 first, then look for it to bounce to $383. We’ll need SHOP to get through its stock split before heading to its next inflection point.

AMZN — Trading near its daily 21 EMA at $113. If AMZN holds its daily mean, look for it to work its way to the trendline structure above to its 50 simple moving average (SMA) at $120. If AMZN does not hold $113, look for a drop to $109 and $107.

I’ll be live in the Simpler Day Trading room from Wednesday to Friday this week to cover the market open. Tune in to trade these setups with me live and look for more potential opportunities in the market.


Stay Focused!


Bulls Lead into Quarterly Expiration?


The bulls made progress for the overall market last week.

The S&P 500 (SPY) gapped up through $385 and closed slightly above its 21 exponential moving average (EMA) on Friday. We’re seeing a switch from the Big 3 sell signals to bullish Big 3 buy signals now.

Keep in mind this coming Thursday, June 30th is the quarterly expiration. This tends to be a larger event as the market often leans heavily to one side, whether that be bullish or bearish.

In the video above, we’ll look at the bigger picture of the overall market and review setups on TSLA and GOOGL. 

Stay Focused!


SPY to $390 or $400?


The bulls finally took control this week. 

We saw the S&P 500 (SPY) rally into its daily 21 exponential moving average (EMA) at $390. We also saw heavily-weighted names like AMZN, GOOGL, and TSLA begin to rebuild the structure of their charts. This points toward the potential for more upside. 

As far as the TSLA setup goes, this is one of our favorite picks for a rip into higher prices next week. TSLA was one of the first setups where the Big 3 bars went neutral across all time frames. This is an indication that the selling pressure is coming to an end.

At the close on Friday, TSLA traded above the daily 21 EMA with squeezes on the daily, 4-hour, and 15-minute time frames. In addition to these squeezes, TSLA also has green Big 3 bars (our buy signal) on the 30-minute and 15-minute charts.

Keep in mind, individual stocks will move with the market. 

In the event SPY fails to trade above $390, it’s unlikely stocks like TSLA will trade higher. 

However, if the bulls can run the market higher, we’re looking for leadership in the setups printing our buy signals.

Our target for TSLA is a push into $790 to $800. We’ll be covering a more of the setups on our watch list in the Sunday newsletter video. 

Stay Focused!


Using Market Internals: $ADD, $TICK


Let’s break down how I use my two favorite internals to better understand what moves the market.

We’ll combine how to understand $ADD and $TICK with the overall market to get a better sense, gauge, and feel when you are trading the major indexes. Understanding market internals can be especially helpful in identifying trends and choosing more precise entries and exits.

You must include the dollar sign ($) before the ticker name when entering the tickers into your trading platform.

$ADD: Advanced Decline Line

$ADD shows whether most stocks are trading or advancing above (or below) their prior close. This gives us a sense of what the overall market is doing. 

Here’s how one reads $ADD on a chart:

  • Above zero (positive): Most stocks are up for the day, green day
  • Below zero (negative): Most stocks are moving lower for the day, red day


$ADD


In the image above, when $ADD was steadily trading sideways above zero (in the bottom left-hand corner), the S&P 500 (/ES) was also chopping to the side with a slightly green day.

When thinking about $ADD, we like to think of it as the steering wheel of a car pointing us in specific directions.

$TICK:

$TICK shows how fast things are getting bought and sold. Consider $TICK as the gas pedal for our car metaphor, representing how quickly price is moving.

There are certain levels and zones that we like to focus on for $TICK:

  • Zero: When the market is chopping sideways
  • Upper zones: $600 to $1000
  • Lower zones: -$600 to -$1000

When $TICK starts to reach the upper threshold from $600 to $1000, this indicates extreme popping or buying. If $TICK stays in this upper range, price will likely explode. Think of this as pushing on the throttle and sending the car forward (or, in this case, pushing price higher).

On the flip side, when $TICK hits the lower zone, extreme selling is happening. We can think of this as pushing on the car brakes.


$TICK


When we put the two internals together, we can ultimately get a confirmation of the move ($ADD) and then see how fast the move will unfold ($TICK).

Case Study: 2/10/2022

In the video below, we’ll walk through both $ADD and $TICK. We’ll go through what I look for and how I use the internals to gauge the overall market using an example from Thursday, February 10, 2022.


We hope you’ve enjoyed this introduction to using $ADD and $TICK to get a better edge in trading. Understanding how to use these internals can be especially useful in defining trends in the market and understanding when exactly to enter and exit your trading positions.

Especially in volatile conditions, we can use these tools to better understand what’s happening in the market and take advantage of big moves.

Stay Focused!


Stop Buying Dip in Energy?


Due to the Juneteenth holiday, the market is closed on Monday, June 20th so we have a short holiday week ahead.

Energy (XLE) has been one of the strongest trends in the market this year. We’ve been buying every dip until now. 

Last week, energy (XLE) and natural gas (UNG) lost their buy signals and bullish structure. We saw energy, natural gas, and names like VLO and OXY print sell signals and show steep percent declines.

When it comes to buying the dip or playing the trend, focus on structure. 

In the video above, we’ll review the structure change in energy names. We’ll also review one of our favorite setups printing bullish big 3 bars with a daily squeeze across multiple time frames.

Stay Focused!


End of Bullish Trends?


The last 3 to 4 months, we’ve highlighted the energy (XLE) and natural gas (UNG) trends as the best buy-the-dip opportunities in the market. And, for the last 3 to 4 months, that game plan has served us incredibly well. 

However, it’s looking like those bullish trends stop here (for now).

We work our “buy-the-dip game plan” when (and only when) our bullish signals are present. 

As of Monday, the energy and natural gas charts stopped printing our bullish signals. This was our first heads up that things might begin to break down.


XLE Daily Chart


Our buy signals are based on our bullish trend, structure, and momentum criteria. The signal gets printed (green bars) when at least 6 out of our 7 criteria are met. In order to get the daily buy signal, the weekly chart must also meet our criteria.

So long as we have the buy signal, we look to get long. As soon as the signal is cancelled, it’s time to get cautious.

Since losing our daily buy signals, here’s how much the recent leaders have fallen over the last 3 to 4 days:

  • XLE: -14%
  • OXY: -9%
  • VLO: -18%
  • MPC: -17%

See how quickly things can change? 

This is why as traders, we need to know when to move on to new trends and setups. Far too often, traders don’t know when it’s time to stop buying the dip. This can result to giving back all the profits made when the trend was actually in tact. That’s a big “no-no”, and giving back profits like that should be avoided like the plague.

We thank these trends for their service over the last few months, but for now we’ll be avoiding getting long energy and natural gas until our signals show up again.

In Sunday’s video, we’ll dive deeper and look at these signals across the markets.

Stay Focused!


Triple Witching Caps Off Bloody Week


It’s been a bloody week, with the major indexes dropping lower on Thursday.

It has been a week full of catalysts with SPX roll, rebalancing, the Federal Open Market Committee (FOMC), and triple witching. Be mindful of these events, especially triple witching (which ends on Friday), as this can lead to more chop.

The S&P 500 (/ES) gapped down from the upper zone at $3,807 to $3,855 on Thursday. It dropped broke inside of a key zone to create a new low at $3,642.

The /ES may continue to chop in this lower range from $3,656 to $3,720. If it breaks below this zone, look for it to hit our target at $3,596.

Keep in mind the market is closed on Monday, June 20th. Pay attention to the price action as big money does take this into consideration.

In the video above, we’ll review the key zones of the major indexes for Friday and setups on our focused list, including ROKU, SHOP, and AAPL.

Stay Focused!


TTM Squeeze Weekly Setups: Options Mid-Week Update


In the bigger picture, we’re seeing a bearish market as the weekly squeeze fired short on the S&P 500 (/ES). This leads to the potential for 5 to 8 weeks of bearish momentum. Now that we are through the Fed and Federal Reserve Chairman Jerome Powell’s statement, the question becomes if we’ll see any short-term bounces. As long as the 15-min, 30-min, and hourly charts don’t have sell signals, we could see some upside short-term potential. In this week’s update, we’ll lay out the two types of way we can trade this market and outline setups on our watchlist.


Stacked Week, Be Ready


The week started off on Monday with the market gapping down and printing red names across the board.

There are a number of stacked catalysts to watch out for this week. 

The SPX index rollover continues this week. This is when big money sells and rolls into their further-out quarterly expiration contracts. So far, this has caused big moves to the downside. 

We also have a large option expiration event called triple quad witching. Look for options to expire and for premiums to be affected by this.

As we head into a new quarter, we also have S&P rebalancing. This involves big funds and firms needing to rebalance their portfolios and follow rules that allow them a certain number of stocks and sectors.

To top it off, the Federal Open Market Committee (FOMC) statement addressing the interest rates decision will be released in the afternoon on Wednesday, June 15. This will be followed up with a statement by Federal Reserve Chairman Jerome Powell.

The S&P 500 (/ES) sold off at the end of last week to $3,900. This week started with a major gap down to the previous low of the year at $3,807.

Be mindful of the key zone from $3,807 to $3,855 as this will be our compass for the next market pop or drop. 

Above this zone, the market could seek liquidity toward $3,900 to $3,930.

If the /ES doesn’t break above $3,807, we could see chop or a flush lower potentially to $3,656.

Here is our focused list:

NVDA — NVDA is trading near two major key levels at $155.67 and $152. If NVDA holds this $152 to $155 zone, focus on a pop above the trendline structure at $162. Through $162, look for NVDA to hit $167 and fill the gap to $168. If NVDA can’t break through $162, we could see chop or a drop toward the $155 to $152 zone. Below this, we’ll look for it to hit $148 to $142.

SHOP  — SHOP is nearing major levels from $308 to $305. SHOP could pop from $305 to the $334 to $340 zone and fail. If SHOP can get through this zone, then $350 to $360 is possible. If SHOP fails to break through $322 and fails at $305, look for it to hit $282 and then potentially buy the dip.

AAPL — We’re using AAPL as a major compass for the market. If AAPL holds $132, it could fill the gap to $137. Through $137, we have $141 as the next target. If AAPL breaks $132, be aware of potential chop or a drop to $129.

ROKU — Employees started a rumor last week that Roku might join Netflix. On Monday, ROKU closed below the key level at $75. If ROKU breaks above $75, it could work its way toward $80 and then the $83 to $85 zone. If ROKU fails at $75, we could see a drop to $67.

Stay Focused!