The S&P 500 (/ES) rallied to the weekly 21 exponential moving average (EMA) on Friday but closed the week below the weekly mean. Keep in mind that it’s completely normal to see a reversion to the weekly mean in a bearish market, just as we’ve seen flushes to the weekly mean in bullish markets.
What this means for the short term is things could appear more bullish. So long as the market closes below the weekly mean, we can use these rallies to the weekly 21 EMA as opportunities to get short.
For now, we’ll patiently wait for the Volatility Index (VIX) to rise and trigger more downside momentum before we enter short positions on the indexes.
In the video above, we’ll lay out scenarios we could see with our line in the sand, trend/structure, and volatility.
This week the S&P 500 (SPY) rallied back to the weekly 21 exponential moving average (EMA), which is a pivotal level of resistance for this bearish trend. For both the bears and the bulls, how the market behaves at this level will likely dictate the direction of the next few weeks.
Keep in mind that reversions to the weekly 21 EMA are normal throughout the course of a trend. Looking at the chart below, you can see that last year we had several pullbacks to the weekly mean, which all made for great buying opportunities.
SPY Weekly Chart
In a bearish trend, rallies to the weekly 21 EMA make for great opportunities to get short, so long as the market continues to finish the week closing below the mean. At the moment we are patiently waiting to initiate a few shorts on the indexes here, but we’ll need volatility to spike to start triggering more downside.
VIX Weekly Chart
While the SPY rallied to its weekly mean on Friday, the Volatility Index (VIX) faded to its own weekly 21 EMA, which could be the “low” for volatility.
Watch VIX closely next week, especially after having closed Friday trading under the bottom daily Bollinger band. In the event VIX begins to rally from here, we could see the markets begin to roll back over.
Remember there’s no need to rush trade ideas in this environment.
Focus on structure, identify your levels, and patiently let things unfold while you pick your spots wisely. If the markets finish next week with a close above the weekly mean, it signals a big shift in trend and structure and would require us to begin tweaking our game plan.
So long as we’re under the weekly 21 EMA, be prepared for the next flush once VIX begins to wake up.
It’s extremely critical to take a step back and make sense of the mamba market during these wild, explosive bounces in an overall bearish market. The market is at a critical point inside of the Ichimoku Cloud on the weekly chart of the S&P 500 (/ES), showing a warning sign that bulls are trying to take control. In this video, we’ll lay out the road map going forward with the big trading events this week, talking through reversions to the mean, identifying key zones/liquidity levels, and reviewing setups on $SNOW, $SHOP, and $GOOGL.
Happy Sunday, traders! Focusing on short positions has served us well over the last month or so, but we are still looking for another new low. Will these bearish daily squeezes in the indexes fire short and get the job done? Let’s dive in!
The market had a monster rip on Thursday as we approach the end of this busy trading week.
It’s been a volatile week dealing with big catalysts with the Federal Reserve, interest rate decisions, and retail sales. Keep an eye out on Friday as big money will rebalance their portfolios and equity options and index options & futures expire due to triple quad witching.
When we see big pops for a few days straight like this, it’s important to flip the switch and capitalize on these big moves. We have to stay flexible and switch from shorting pops to buying dips.
As the S&P 500 (/ES) is still trading under the daily Ichimoku Cloud, keep in mind that we can see price rip to key ranges, stop and reverse, and head lower. The range from $4,400 to $4,455 is a hard level that the ES will either break through or hit and roll over.
In the video above, we’ll discuss the key liquidity levels for the market indices, how volatility can shape the narrative, and potential setups on SNOW, SHOP, TSLA, AND NVDA.
We’re expecting a busy week of catalysts for the market with events on the trading calendar, economic calendar, and world wide news.
Market Events
On March 18th, we have triple quad witching – the expiration of equity options and index options & futures. Pay attention as this could lead to liquidity hunting, pinning at levels, and many options getting destroyed.
S&P Indexes rebalancing also occurs on Friday, which is when big money rebalances their portfolios at the end of the quarter. Be prepared as we could see certain stocks pop and rip hard or unexpectedly drop.
Take a look at the economic calendar on Wednesday for retail sales in the morning and the statement from Federal Reserve Chairman Jerome Powell in the afternoon.
As for the headlines, there are many catalysts from Ukraine and Russia to China that could affect the market.
Here is our focused list:
AAPL — Negative supply chain news over the weekend caused a large drop into Monday. The make-or-break zone is $151.90 to $154.70, with the 200-day simple moving average (SMA) at $153.60. If AAPL drops below this zone, it could hit $147 and lead the technology sector lower.
NVDA — Liquidity is above at the $225 to $230 zone, with point of control (POC) specifically at $226. If NVDA hits $208 to $206, it could dump hard to $200 and $195. If NVDA pops, it could hit multiple key levels above starting with $218.
SHOP — As long as SHOP is below $585 to $574, SHOP appears bearish. The largest level we’re watching is $500. If SHOP fails to break through $529, it will likely breach $500 to $470. If it pops through $529 and holds, it could hit POC at $556.
Heading into the new week, the market is showing bearish structure across the board on the major indexes. The issue lies in the fact that there isn’t much movement happening because of large levels of support.
Note that the key level of support for the S&P 500 (SPY) is $420.
There are weekly and daily squeezes on the SPY with lower time frame squeezes on the 4-hour, 2-hour, 1-hour, and 30-minute charts. These nested squeezes could fuel the fire short and take the market through the key level of support at $420.
Remember, a squeeze is a large build up of energy. If the market can release a large amount of energy and break support below, this could trigger a move into a new low.
In the video above, we’ll discuss the scenarios for the market next week and review both short and long setups on names like INTC, IWM, AMZN, and UBER.
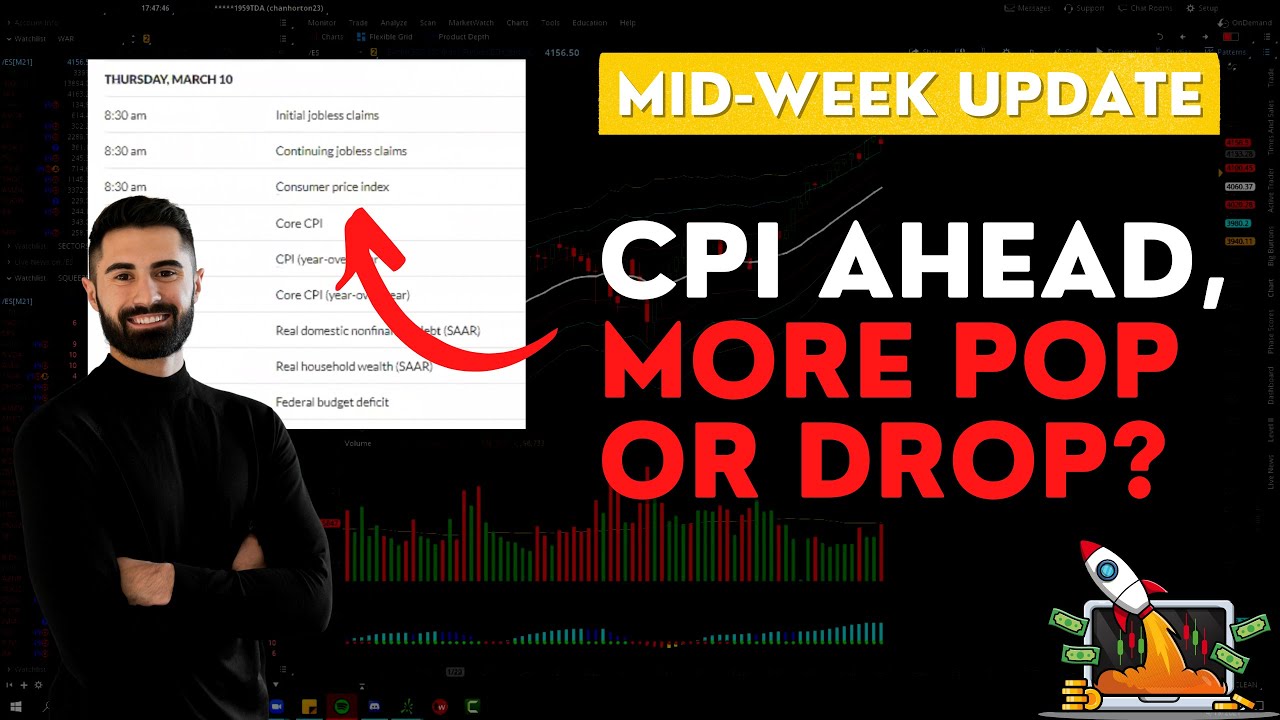
Let’s dive in and discuss this volatile market and hopefully give you some clarity for the rest of the week. First we have the Consumer Price Index (CPI) on Thursday, March 10th at 8:30am that could be a catalyst and move the market. This economic event will be a big gauge of inflation and how much more consumers are paying for products. After a flush earlier in the week, the S&P 500 (ES) popped on Wednesday and further showed the whipsaw market we are in… so let’s discuss how to navigate this environment moving forward.