Join Taylor for a bonus live premarket prep and we’ll run the scans together.
Options Trading Live Prep: 1/21
Join Taylor for a bonus live premarket prep and we’ll run the scans together.
Join Taylor Horton every Monday morning at 7:45am CT for live morning prep before the market opens.
The market has been “mad” at the Federal Reserve since the January 5th FOMC announcement saying, “it may become warranted to increase the federal funds rate sooner or at a faster pace than participants had earlier anticipated”. The market has been selling off ever since and closed at the weekly 21 exponential moving average (EMA) for the first time this year. We can use this as a compass for the rest of the week to see if the market will trade below the weekly mean and turn vulnerable.
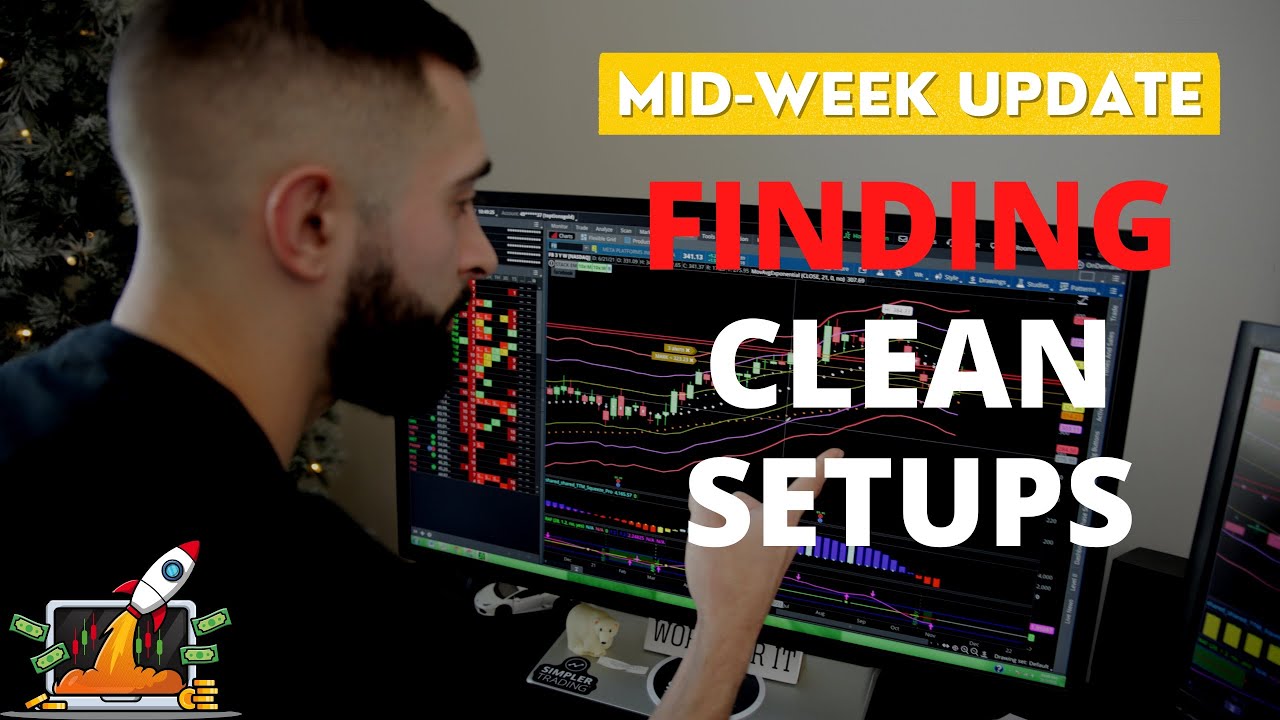
These are my favorite free & premium indicators, and the only tools I rely on! Let’s take a deep-dive into the moving averages, keltner channels, 10x bars, and the rest of the indicators you see on my charts.
INDICATORS USED:
– 8 & 21 Period EMA’s (weekly and daily)
– Squeeze Pro Indicator: https://www.simplertrading.com/squeeze-pro-indicator/
– Keltner Channels
– Stacked EMA’s label (5, 8, 21, 34, 55, 89 EMAs stacked on top of each other)
– 10x Bar Labels: https://www.simplertrading.com/multi-10x-indicator/
– Multi Squeeze Labels: https://www.simplertrading.com/courses/multi-squeeze-pro/
– B3 Buy Signals
Buy the Dip or Sell the Rip for big tech? There are still spots with strong trends and strong setups, ie: energy and the financials. Let’s check out the market conditions and new setups on our focus list like PSA, AZO, and DLTR.
Happy Monday, traders! Heading into this weeks trading, we have the $QQQ trading at major support. Whether or not this level holds could have a major impact on the overall market, so let’s dive in and get ready for today’s session ????
The market has been very vulnerable and weak as we’re trading in a “short-the-pop” type of environment.
The last two weeks the market has sold off after negative comments from the Federal Reserve, as the S&P 500 (ES) hit the weekly mean and dived straight down for a complete rollover on Thursday.
When the structure changes like this, we need to be ready to “short the pops” and not just buy the dip like so many of us are conditioned to do. We’re seeing a downtrend as the ES broke below the weekly mean and broke inside of the Ichimoku Cloud, so every pop now becomes a short opportunity.
We will see a green day eventually, but as of now the market is vulnerable and that is what matters most. We will lay out major inflection points to mark on your charts, so we can gauge future market moves.
Stay Focused!
Let’s preface the shortened upcoming week as the market is chopping in a volatile manner. We’ll review some important upcoming earnings events, specifically with Netflix (NFLX) kicking off big technology earnings on Thursday.
We’re building upon our inflection points, focusing on the reversion to the weekly 21 exponential moving average (EMA) for the S&P 500 (ES).
Here is our focused list:
GOOGL — Be patient as it is stuck underneath the daily Ichimoku Cloud. Once GOOGL breaks through the Cloud bottom at $2,820, then we can look for a reversion to the daily mean around $2,850.
NVDA — We could play this name in both directions, since it had a nice close above the weekly mean on Friday. This inflection point could be a great dip buy, but it all depends on what big technology and the overall market can do. If NVDA can rally off the weekly mean, then look for it to head to the daily mean at $285.
Stay Focused!
We’re doing things differently for Sunday’s prep list, as we’re running our scans before the market closes on Friday. We’re looking for setups with solid structure and momentum to add to our watchlist. We’ll show the most important things to incorporate into your weekend watchlist building – because structure is the name of the game in this market.
Many of us traders have gotten into the habit of having a bias for our favorite stocks. Think about stocks in big technology and semiconductors like FB, AAPL, TSLA, NFLX, NVDA, and AMD. These stocks have served us well over the last few years, but it’s important to keep our focus on what is setting up best in the current market.
The major reason for this is if you look at the monthly chart of the QQQ, it has spent the last two years firing a monthly squeeze to the upside. This becomes our biggest source of non-stop momentum, so when we do see this squeeze to the upside we want to focus on those big technology stocks that have wind on their backs.
However, in the current market where the tech winds have died down we’re more focused on structure.
The stock doesn’t matter, the setup does.
So let’s fire up the scans together to find good setups that fit the bill.
Stay Focused!
Uptrends are easy to trade, downtrends are easy to trade, but choppy “transition periods” can be difficult. Right now, that’s what this current environment is feeling like, as the monthly squeeze that provided us with so much momentum over the last two years has lost energy.
The key to remaining profitable during these choppy transitions is to seek balance in your trades with a few longs and a few shorts. Once the trend is clearer, the focus should revert back to placing trades only in the direction of trend. In the meantime, keep it simple and look to get long the best setups possible, and short the ugly ones.
In terms of ugly, we initiated a short position on the IWM this week. Unlike the SPY, QQQ, and Dow Jones, the IWM is seeing a loss of structure on the weekly chart with momentum very much bearish. Looking at the chart of the weekly squeeze below, note the lack of positively stacked exponential moving averages (EMAs), mixed with a close under -1 average true range (ATR), and bearish histograms/10x bars across the board. While the small caps have been very much trapped in consolidation, this shift of momentum and loss of structure suggests the energy may be fixing to get released to the downside.
Our initial target is a move down into $200, and we will look to add to our current position on any oversold bounce into the daily 21 EMA. For this trade, we are risking 1 to make 2 with a slightly in-the-money (ITM) call credit spread.

In terms of setups that still have bullish trend, structure, and momentum characteristics, one of our favorites at the moment is MP, which we have a February expiration long position in the Compounding Growth Mastery. LCID, AZO, GILD, QCOM, and LITE are also on the watchlist and all have the criteria we need to justify a long position.


Heading into next week, we’ll be looking for more clarity out of the indexes in regards to what the path of least resistance will be in the markets moving forward. If the path is “chop”, we’ll continue to short the pigs and get long the charts that continue to look poised for higher prices.
In Sunday’s watchlist video, we have a small “homework” assignment for all of you, so keep an eye out for that!
Stay Focused!