With a loss of market structure and momentum, the path of least resistance is showing to the downside.
We’re looking to price out a call credit spread on the QQQ. If we can lock in that trade, we’ll look for an exit above $375 which is the weekly 21 exponential moving average (EMA). To the downside, we’ll look for a profit target near the recent low at $330.
Ideally we’re looking for a big bounce in the indexes early next week. Because of trend, structure, and momentum, our plan is to short the bounce.
As the indexes begin to look increasingly bearish as the weeks go by, it’s important to keep in mind that many of the same principles that keep you profitable in a bullish market will serve you well in a downtrend.
A great tip for newer traders is to look at the inverse charts of the current indexes (to look at inverse charts, just enter a minus sign before any ticker). Looking at the inverse charts will likely be more “familiar” as the inverse of the indexes looks bullish.
QQQ Inverse Daily Chart
Looking at the inverse chart of the QQQ above, while it looks bullish, it is far too extended to get aggressively long at these levels. In an uptrend, we would wait for the next dip to the 21 exponential moving average (EMA) before getting short.
Taking that same principle, when we look at the actual QQQ, though it’s bearish, it is far too extended to the downside to place a good short here. With that being said, we are looking for bounces early next week, ideally into the 21 EMA as our next opportunity to enter a low-risk, high-reward short.
QQQ Daily Chart
Since volatility is what brings the market down, we’ll need to see the Volatility Index (VIX) flush back to its own 21 EMA next week to give the indexes a chance at rallying. If the VIX – some call it the “fear” index – can in fact fade to the downside, we’ll be ready to enter some shorts on the indexes. We’ll be watching for a break under the recent lows into February and March.
So long as the structure is bearish, we’ll be looking to play the “ebbs and flows” of the market in the path of least resistance.
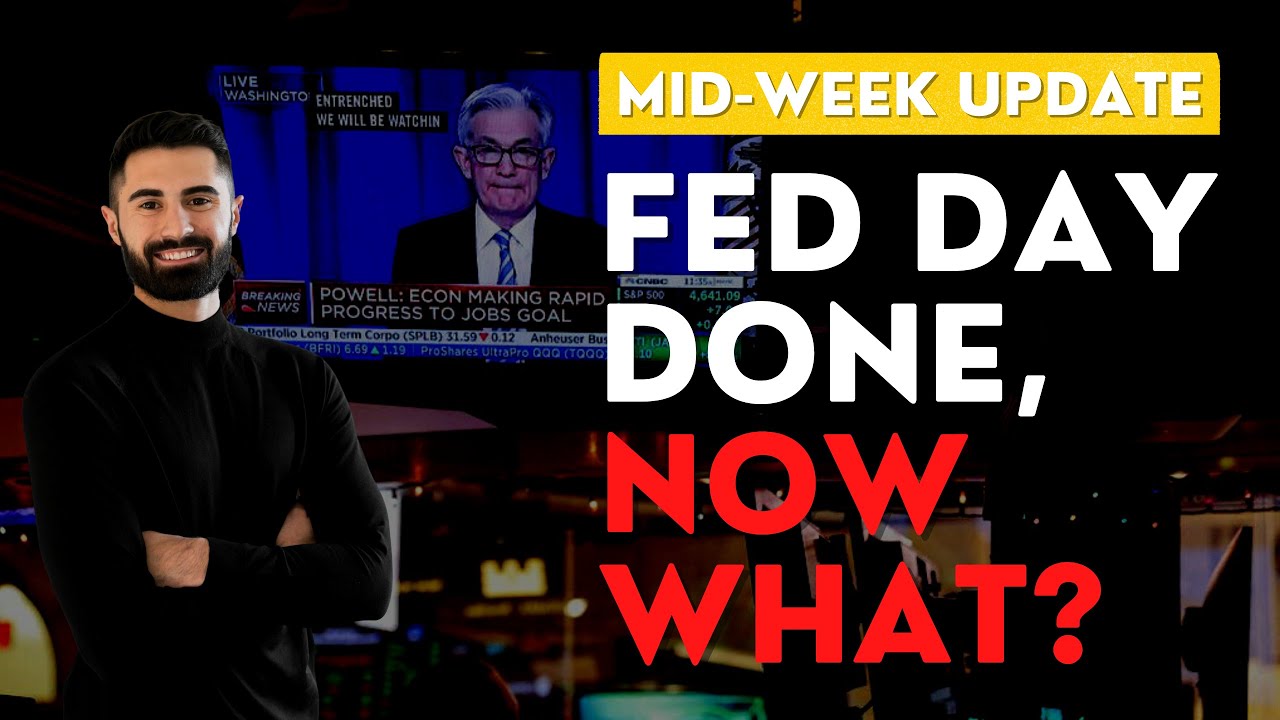
Happy Wednesday and happy Fed Day! The last FOMC event on January 5th changed the sentiment of the market to a “short the pops” environment. Today we had our next Fed event and after hearing from Federal Reserve Chairman Jerome Powell, the market rolled over and tanked. We’re in a vulnerable and volatile market, so let’s discuss upcoming opportunities and setups amid the Fed news and earnings.
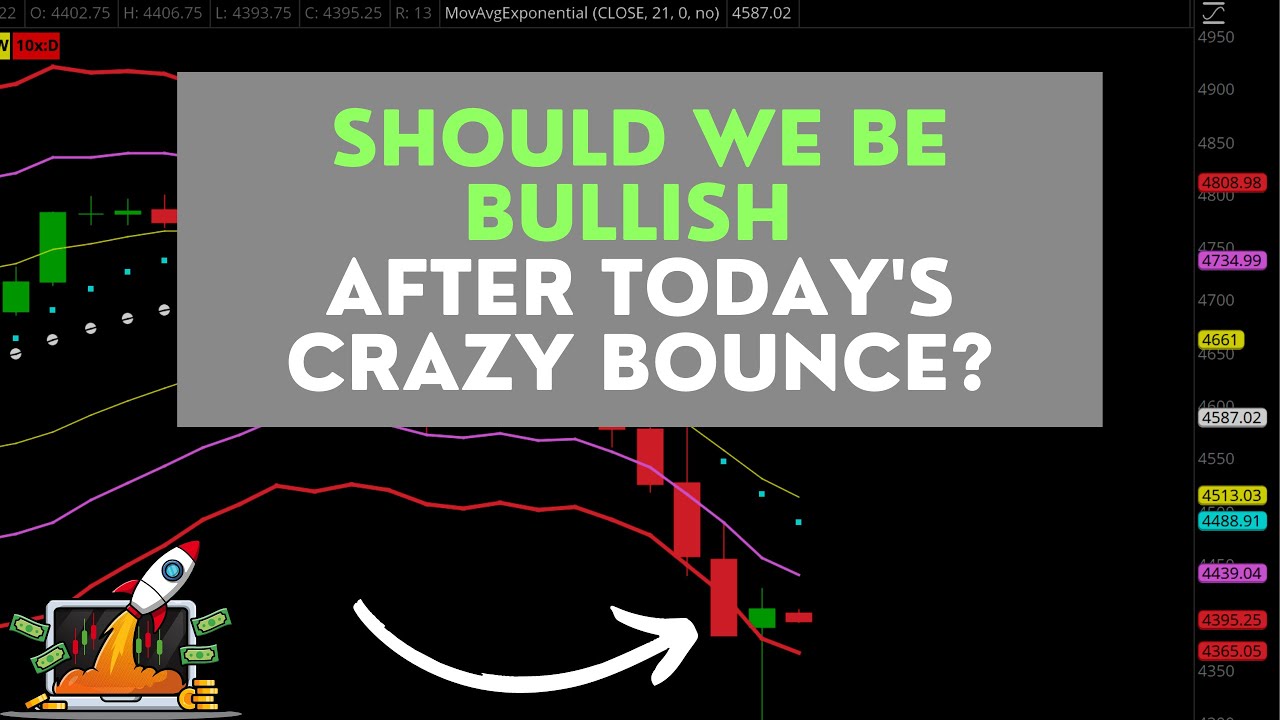
This morning started with a nasty flush, and ended with an even nastier bounce into the close. Does today’s action “fix” the problems we’ve been seeing in the markets? Not so fast…let’s take a look!
Happy Sunday, traders! It’s a busy week ahead with big earnings + JP & the Fed on Wednesday ???? I’ll be looking to short the the markets on the next bounce, so let’s take a look at all the reasons that lead me to believe we’ll be trending lower ????
Registration for this Saturday’s class: https://bit.ly/3FNekDV
Now that we made it through the Federal Reserve meeting, let’s lay out a few scenarios moving forward to continue trading strong.
The S&P 500 (ES) dropped hard following the Federal Open Market Committee (FOMC) statement, popped Thursday morning, and now the market is stuck in chop.
The ES is in a consolidation phase stuck between two big inflection points. First the ES broke through the $4,492 zone with the 200-day simple moving average (SMA). Now it is trading above the lower inflection point at $4,260 and the low of the week at $4,126.75.
The overall market is trending lower, and volatility remains high. As long as the Volatility Index (VIX) trades above 20, downside volatility is favored.
The catalyst that could influence what we see next is the ongoing earnings season. We are picking up into the heart of this earnings season, anticipating the AAPL report on Thursday night and AMZN and GOOGL coming up next week.
The earnings releases could change the sentiment of the market or add fuel to the fire for selling.
Watch the video above for potential scenarios we could see in the overall market and our focus list of actionable setups moving forward.
We’re anticipating another volatile and eventful week as we have multiple catalysts that can impact the overall market.
We’re getting into the gist of earnings season after banks earnings last week. This week we are anticipating releases from big technology names like MSFT on Tuesday, BA and TSLA on Wednesday, and AAPL on Thursday. NFLX got destroyed after its earnings last week, so we’re interested to see if we can find new plays on the technology stocks going forward.
On Wednesday at 2 p.m. Eastern we’ll see the Federal Open Market Committee (FOMC) statement followed by Federal Reserve Chairman Jerome Powell speaking at 2:30 p.m. Eastern. The market will most likely head lower into the FOMC meeting, which is why it’s so important to understand how these economic events impact the market.
We’ve been in a short-the-pop type of environment since Powell’s last statement on Jan. 5 with incredible opportunities to short the market. The S&P 500 (ES) closed below the 200-day simple moving average (SMA) on Friday, taking out huge levels.
That being said, we’re mainly focusing on playing the overall market on SPY, QQQ, SPX, etc.
Here is our focused list:
NVDA — At large technical levels after breaching below the 200-day SMA. NVDA showed relative strength after closing above the 200-day SMA on Monday. This could be a nice pop for a dip buy if NVDA retests the 200-day SMA. Potential targets to the upside could range from $250 to $255.
Last week we saw nasty price action with the S&P 500 (ES) down 2% and the Nasdaq (NQ) down 3%, driving the overall market lower into the weekend.
If we look at the put call ratio (PCALL), it is showing a reading that most traders are positioned short right now. The market is extended, so there could be short-term bounces coming.
The major thing to keep in mind is the monthly squeeze in the indexes that fired to the upside is now over, having lost momentum and structure. For the first time since this squeeze, the ES closed below the 8 exponential moving average (EMA), which typically will push price down to the monthly 21 EMA.
The key in this environment is to play the ebbs and flows of the market where the path of least resistance is – to the downside.
Sign Up for my FREE Webinar this Wednesday, Jan 26 at 7 p.m. Central as we discuss how to stay profitable in this downtrend.
After a two-year run of support, the market is signaling a shift.
From top to bottom, trend, structure, and momentum in the markets continue to turn bearish. Here’s a look at what we’re seeing as the environment shifts…
MONTHLY CHARTS
The SPY and QQQ fired monthly squeezes to the upside back in early 2020. Those squeezes were responsible for the trend and momentum that we experienced up until recently.
As these squeezes show a loss of momentum, recent closes under the monthly 8 exponential moving average (EMA) open the door for a potential flush down to the monthly 21 EMA. Meaning the market could have plenty more downside to come.
QQQ Monthly Chart
WEEKLY CHARTS
Ever since April 2020, the 21 EMA on the weekly chart has been a major level of support for this trend in both the SPY and QQQ. With Friday’s close, both indexes find themselves heading into the weekend trading under what has been critical support throughout the entirety of this trend.
QQQ Weekly Chart
With a loss of momentum and now structure on these bigger time frames, we are led to believe the path of least resistance will be to the downside. Now, much like when trading the upside, we want to pick our spots wisely with good entries. With that being said, next week we will be looking to short any bounces in the market.
One of our major focuses for new shorts is the IWM, which we closed a profitable short on Friday morning in the Compounding Growth Mastery. We initiated the short on Jan. 10 and closed the position on our move into our $200 target for 85%+ return on risk.
This short was so nice, we’re looking to do it twice.
IWM Daily Chart
In the weekend video on Sunday, we’ll be covering these shifts in the market in detail, along with looking at the results of our short setup scans.
The key to remaining profitable as a trader is to stay on the right side of the market. Until things change, our opinion is that the path of least resistance will be lower!
If you haven’t already seen my recent webinar on my 2022 Game Plan discussing win rates, limiting losses, and finding clean setups, watch the free replay here.