Shorting has become a popular topic of discussion as of late. The truth is, in terms of path of least resistance uptrends can be difficult to short.
We define an uptrend as a weekly chart trading above the 21 exponential moving average (EMA) with positively stacked EMA’s.
If you look at the S&P 500 (ES), we’ve been in an uptrend since 2020 because there was no point it traded below the weekly 21 EMA. It’s the same case for the Nasdaq (QQQ) since April 2020.
Realistically, when the market drops from +2 to +3 average true ranges (ATR) down to the 21 EMA on a daily chart, all that’s happening is we are pulling back to weekly support followed by a common theme of ripping up to all-time highs.
Shorting an uptrend can be challenging, and it depends on position sizing, risk management, and the choice of strategy. Watch the video above as we discuss the overall trend, key setups, and where we want to add to our current positions.
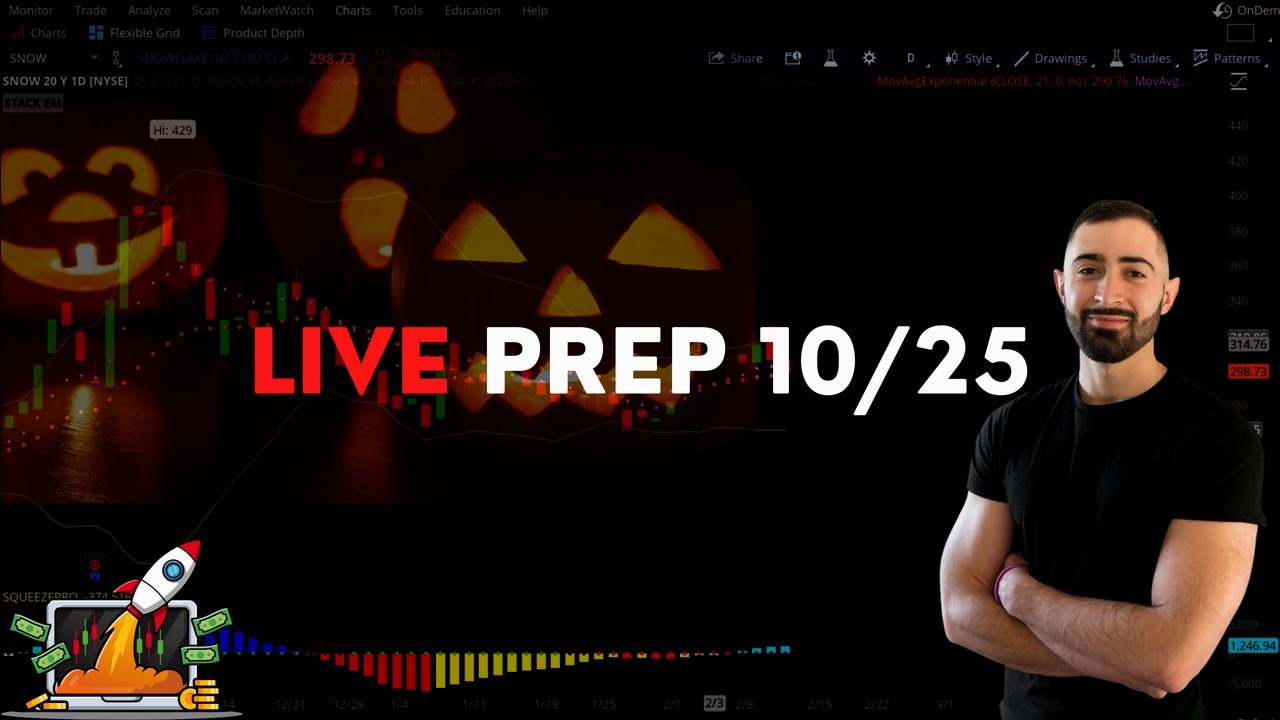
Despite earnings misses from both AMZN and AAPL, two of the most important stocks in the market, nothing could stop the Nasdaq (QQQ) this week. The big question at this point is what will it take for this trend to end or at the very least pullback to the 21 exponential moving average (EMA).
The combination of exhaustion of bullish momentum and sell signals can bring a roaring market to a screeching halt, and there are neither of those to be found on the indexes right now. While we are certainly due for a pullback, we are not looking to fight this trend and instead are looking for opportunities to catch continuation of this momentum.
QQQ Daily Chart
One of our favorite trends here is GOOGL, which quickly rallied to a new all-time high (ATH) after earnings. Into today’s close, we built a long position in the 30-minute squeeze, and we’re looking for a move into $3000+ next week. The structure of the 30-minute squeeze fit all of the same criteria that we look for in a daily squeeze – with positively-stacked EMA’s, green 10x bars, and a positive histogram.
GOOGL Daily Chart
The key with this market has been to look for these ‘moments in time’ but on lower time frames. While waiting for a retracement to the 21 EMA is a good game plan in a normal market, we are not in a normal market here.
Until the party ends, we’ll be looking to pick our spots wisely in leaders like GOOGL in an attempt to catch the continuation of this crazy momentum.
The squeeze is a versatile setup. You just have to know where to look! With that being said, be sure to join us for premarket prep Monday morning at 7:45am Central on the Focused Trades YouTube Channel, as we’ll be running scans for lower time frame squeezes together.
Until then, enjoy your weekend and we look forward to getting back to work on Monday!
We’ve got an exciting week ahead of us with big technology earnings, one name being Googl (or Alphabet). Our first setup we’ll review is GOOGL after it crushed its earnings report, hitting all-time highs at $2,973. The overall market has seen an amazing comeback after a strong selloff over the last few weeks that showed our first downtrend of the year. We’re back at all-time highs and are mostly chopping right below that psychological level of $4,600 with VIX above 16.
Hey traders, today I’ll be showing you how to set up credit spreads on the TastyWorks trading platform. This is an easy-to-use trading platform with good-looking charts that can be set up with trading indicators to identify actionable options trades. This is the first of our TastyWorks tutorial series.
The market has presented some great opportunities with the earnings season still far from over. The S&P 500 (ES) is trading below Tuesday’s all-time high at $4,590 as the bulls continue their strong bounce back.
While the market is extended, this doesn’t necessarily mean it will trade lower. As long as the ES holds $4,549, we expect the market to remain bullish.
The ES is printing a tight 4-hour squeeze ahead of big tech earnings with AAPL and AMZN reporting. If the squeeze fires and the ES breaks all-time highs, we’ll anticipate a push toward $4,360. If not, expect a drop to $4,549 and down to Point of Control (POC) at $4,528.
Avoid having a strong bias in one direction or another, and instead, watch and react to the market.
Watch the video above to see which key levels and earnings reports we’re watching ahead of next week’s economic events. View how we use the Volatility Index (VIX) as a compass and approach potential setup opportunities like on SHOP, NVDA, and FB.
I’ll see those of you signed up for my Max-Out Your Trade strategy class this Saturday, October 30th. If you’re interested in signing up and getting access to the class recording, sign up here: https://bit.ly/3vR5O3o
We’re anticipating a large week of earnings for big technology names including Microsoft, Alphabet, and Apple through Thursday. After a flush the last few weeks, the S&P 500 (ES) exploded on Monday toward all-time highs at $4,564, locking in gains for the bulls.
While the market is technically “extended” this doesn’t mean the market is guaranteed a pullback. As long as earnings reports are strong and the ES maintains highs above $4,551, look for a potential push to the psychological level of $4,600 at 3+ average true range (ATR). This $4,600 level could also be a good spot for a potential pullback.
If earnings report negatively and the ES trades lower, look for a pullback to $4,526 around Point of Control (POC).
Follow the market, watch the earnings reactions, and avoid having a strict bias toward one direction or another.
Here is our focused list:
FB — After lower-than-expected earnings were released, the news of the boost in share buyback authorization sent FB higher. FB has been dipping to the weekly and daily Ichimoku Cloud, which could always present a dip buy opportunity. If FB accelerates higher this week and hits $345, look for it to move to the 50-day simple moving average (SMA) at the $350 levels.
ROKU — While Snapchat earnings sent ROKU lower last week, ROKU created a gap fill between the daily 21 exponential moving average (EMA) at $328 and the 50 SMA at $333. ROKU is printing a 1-hour squeeze and closed at highs on Monday around POC at $324. If it gains momentum, look for ROKU to break through the daily mean and fill the gap to the 50 SMA.
TSLA — TSLA flew higher on Monday, breaking all-time highs past the $1,000 threshold to $1,045. With TSLA extended, it could keep exploding but there is also a big gap to fill on the downside. As long as it holds above $1,000, we’re leaning toward the bullish upside.
MRNA — MRNA started to explode to our zones on Monday past $344 to $349 and looks like it will keep grinding higher. With upcoming news this week, let’s position ourselves to see if MRNA can push through $350, fill the gap at $359, and move to $377. If MRNA pulls back and holds $345, look for a dip buy.
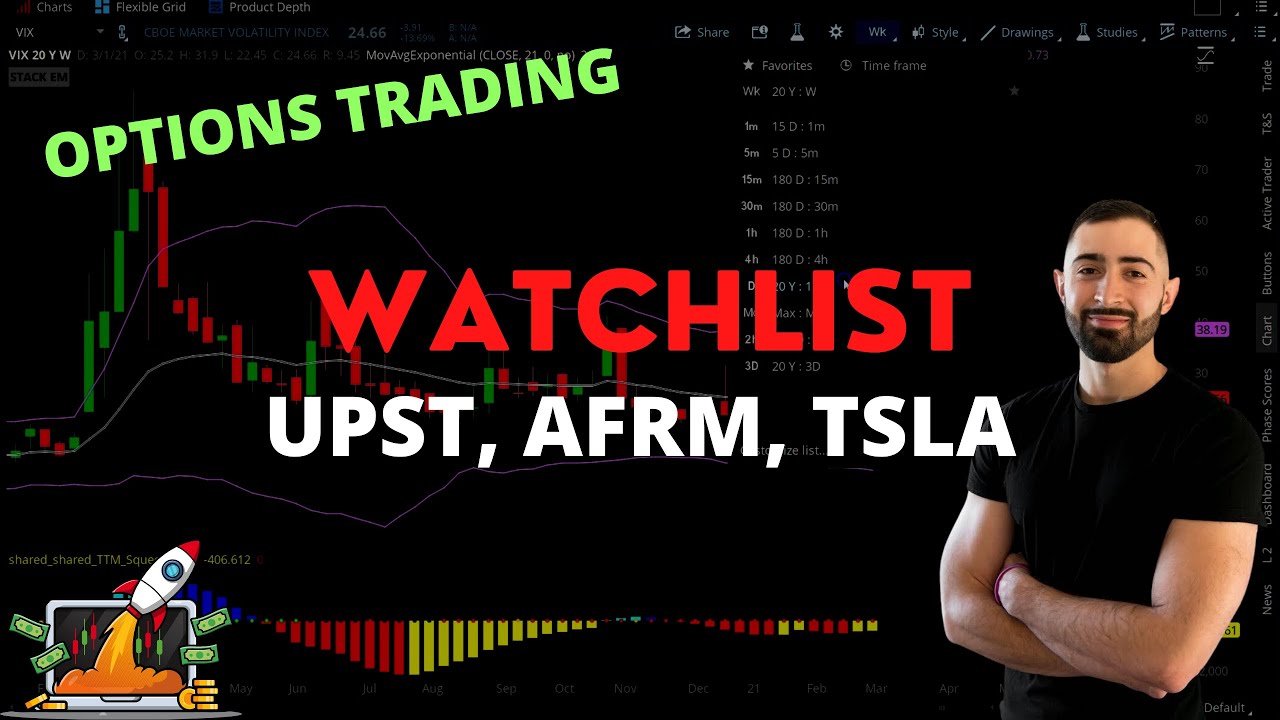
The Volatility Index (VIX) is losing support with a Ready Aim Fire!® (RAF) buy signal suggesting a potential bounce. In the past we’ve seen when the Volatility Index bounces, it tends to send the market to the downside.
With the VIX losing steam, the market may unfold the same way it did last October and roll over to retest the lows.
Will history repeat itself? Maybe, but we need to be ready for the market’s next move.
After seven days of uptrend with low volume, the market is extended and trading at previous all-time highs (ATH). As the S&P 500 (ES) approaches a level of resistance at its ATH of $4,551.50, we’re looking for a dip to the 21 exponential moving average (EMA).
Rather than focusing on which move is next, look for signals and shifts of momentum that can support your position. Remember the current market conditions we’re in:
Market is extended
S&P 500 is at previous all-time highs trading at 2+ average true range (ATR)
Volume is low on the push higher
The VIX is at major support trying to print a buy signal
In today’s video we’ll review last year’s moves in October and determine where to position ourselves, and whether we see a big flush or spike next.