The market sits at a critical point of volatility that will affect not only just the rest of the week but also into the fourth quarter starting in October. On Thursday, the market dealt with quarterly options expiration which gave the market a reason to drop lower.
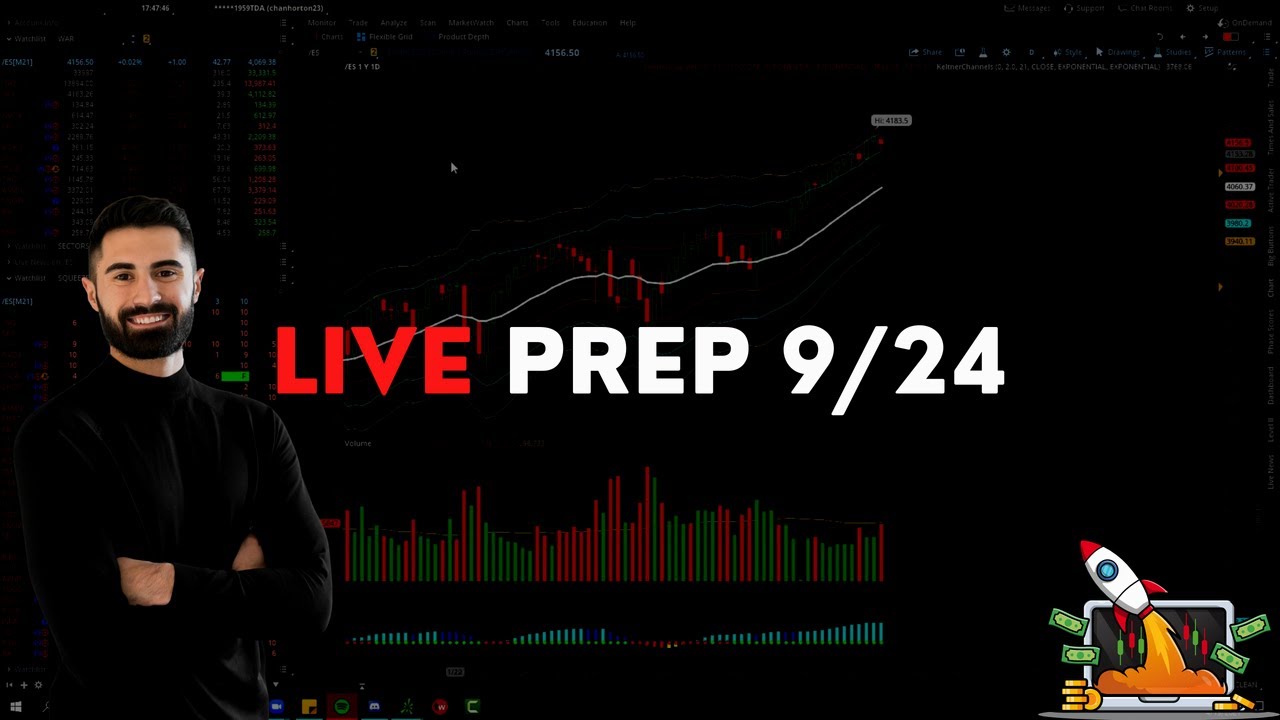
We’re continuing to observe the daily Ichimoku Cloud as a guide for the trend and for the first time this year the S&P 500 (ES) dropped to the bottom of the Cloud. This threatens a potential bearish trend for the first time this year.
Let’s see what the market decides, but be prepared for some potential downside. Use the volatility index (VIX) as an additional compass for price movement across the market.
Watch the video above for a breakdown of key levels we’re watching on the major indexes and the current setups on our focused list like GOOGL, MRNA, SQ, and NFLX. We’ll talk to you in Q4!
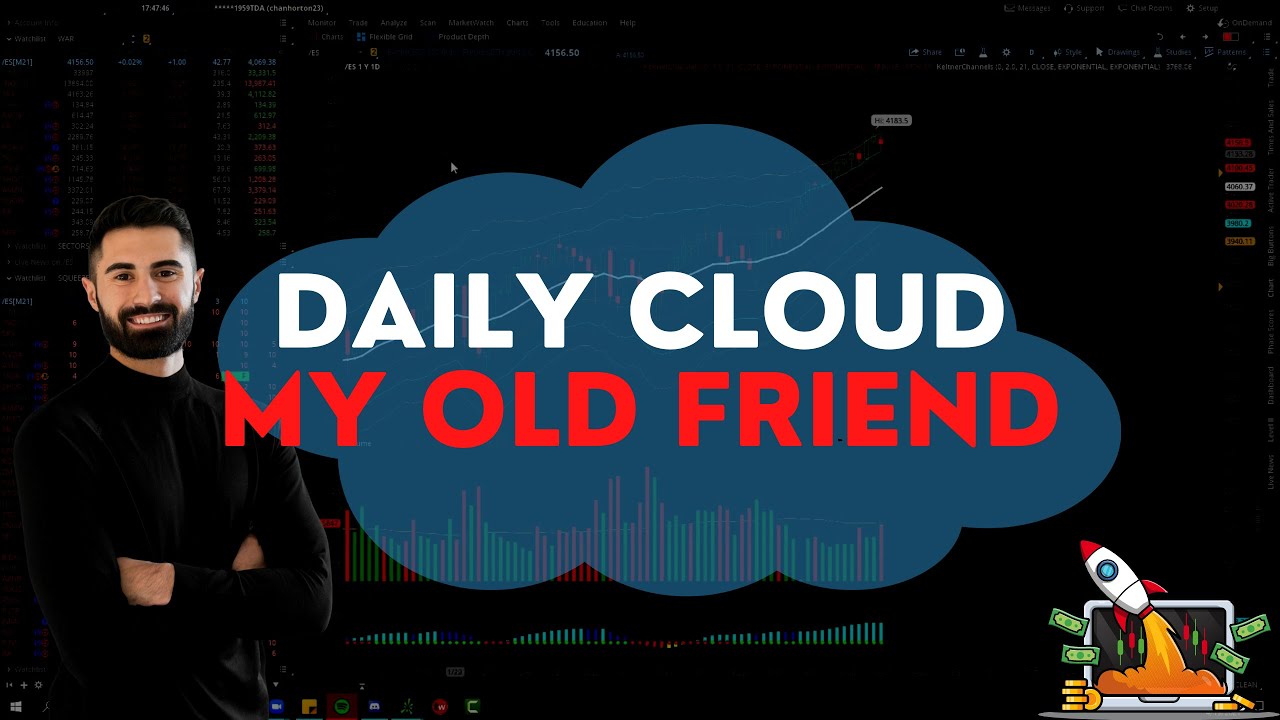
We’re continuing our conversation on the daily Ichimoku Cloud as the S&P 500 (ES) experienced another drop, retested the level, and set up for another dip-buy opportunity. We’re focusing on the range from $4,425 to $4,483 to dictate whether we see another reversal. We approached this range on Monday, but sellers brought the ES right back down.
There are three scenarios we can expect to happen…
We either:
Chop and squeeze in consolidation
Drop and revisit the daily Ichimoku Cloud and lows from last week
Hold $4,425, squeeze higher, and break $4,483
Here is our focused list:
GOOGL — Had a selloff to the 50 simple moving average (SMA) that led to a dip-buy last week and has since exploded higher. Currently squeezing on the daily mean, so keep an eye on the range from point of control (POC) at $2,774 to $2,800. Let’s see if GOOGL chops or breaks higher and pushes it from $2,800 to $2,848 and potentially to all-time highs at $2,900.
ROKU — Continues to bottom out through $350 and $310. ROKU fell on Monday and had a slight pop at the close. Look for a push higher to POC at $322. If it holds POC, look for a push to the upside at the $338 to $341 zone. Use $334 as a strong key level.
AMD — Finally broke $99 and held, then set up a wedge and exploded through it on Monday. Looking for it to rise to the $109 to $112 range. Experienced a healthy pullback to the 50 SMA and is starting to ramp up. A retest of $107 could offer a good dip-buy opportunity to take it up to $109 and $112.
TSLA — Closed above the consolidation zone at $764 on Friday. Broke out of $780 and continued to push higher toward $800 on Monday. Keep an eye out for a dip-buy opportunity up to $815 to $825. First see if TSLA can hold $780 for a dip-buy.
MRNA — Dropped to the bottom of the range at $406 on Monday toward the daily Ichimoku Cloud and the 50 SMA. This could be a good dip-buy if met with support or it could break the $406 level and drop lower. Will MRNA hold the daily Ichimoku Cloud at $406 and pop up to the daily mean at $420 or POC at $429 for a good dip-buy? If we break $406, MRNA could drop down to the 50 SMA at $395.
Last week the markets flushed after experiencing some selling pressure and volatility. Heading into a fresh week, we’re approaching the markets cautiously bullish.
The S&P 500 (ES) dipped to the weekly 21 exponential moving average (EMA) for the first time since last October, which we can expect to see in a very bullish weekly uptrend.
Watch the video above for a look at the major indices and key setups we’re focusing on heading into the new month of October. We’re keeping an eye on the setups that have held their structure regardless of the flush like TSLA, ZS, and NFLX.
Happy Friday, traders! With the markets extended to the upside over the last few weeks, we offered the advice to prepare ourselves for a sudden selloff. Sure enough, the selling pressure finally hit this week as the markets flushed to the downside.
Despite the flush the markets bounced considerably into the end of the week, setting the tone for what should be a very interesting month of October. It continues to be daily charts versus weekly charts here, a classic battle throughout the course of any uptrend.
Both the S&P 500 (SPY) and Nasdaq (QQQ) held bullish structure perfectly this week (charts below), bouncing with a vengeance off their weekly 21 exponential moving averages (EMA). Holding weekly structure implies that the selling pressure may dissipate here, but the structure of the daily charts implies the potential for a lot of back-and-forth chop.
ES Weekly Chart
ES Daily Chart
We are long some good-looking setups here but are moving forward with caution. Should the indexes fail to get back above their daily 21EMA, there is the potential for some nasty chop or another flush. If instead the markets can simply hold firm here, we’ll be looking for the setups that maintained their bullish structure in the face of volatility to continue moving higher.
We’ll cover a few of the setups in detail in Sunday’s video, but names like TSLA, ZS, NFLX, and a few others are catching our attention. TSLA is a perfect example of a stock that held structure perfectly while the rest of the market declined. Not always, but often these are the first stocks to rip higher once the market stabilizes. All week long TSLA held strong inside its 4 hour squeeze, which is on the verge of firing to the upside into Friday’s close.
The put credit spreads we sold in the Compounding Growth Mastery on Thursday are already shaping up nicely and we’ll look for continuation into $780 to $790 next week.
TSLA Daily Chart
With the daily charts of the indexes “leaving a bit to be desired”, patience, discipline, and a strict focus will be very important over the next few weeks. Keep an eye on your inbox for Sunday’s video, where we will dive into setups we think could offer opportunity in the weeks to come.
Happy Wednesday, traders! After an event-filled day with Powell and the FOMC, we’re looking at where the market is heading next. Regardless of the events, every drop in the S&P 500 (ES) this year has hit the 50 simple moving average (SMA) or the daily Ichimoku Cloud. Now that the ES breached the 50 SMA, it dropped to the bottom of the daily Ichimoku Cloud where it found support and held. Do we continue to hold the Daily Cloud? Watch the video for key levels in the major indexes and the rest of the tickers on our Focused List like ROKU, MRNA, and FB.
Happy Monday, traders ???? The futures are down, and the $VIX is up! Like we discussed last week, we need to wait for volatility to puke before we start getting long the markets again. Will today be that day? Let’s take a look.
Keep a tight focus on the daily Ichimoku Cloud. Every time this year, when we’ve seen the S&P 500 (ES) drop below the 50 simple moving average (SMA) it’s continued to bleed down to the daily Ichimoku Cloud for a nice dip buy opportunity.
On Thursday, we finally saw a strong pop off of the daily Ichimoku Cloud back up to where the move originally started.
This year we’ve seen steady explosions lasting about 1 to 2 weeks off of the daily Ichimoku Cloud. Let’s see if we rip higher on Friday past the 50 SMA, daily mean, and the $4,480 key level to a new all-time high or roll back down to the daily cloud again.
Our focused list has ROKU pushing to Point Of Control at $338, MRNA showing an uptrend, FB down on the week, and AMD waiting for a wedge breakout. Watch the video above for a full rundown on the major indices and key levels we’re watching next for our focused list.
The market is heatin’ up to start the week! We’re seeing the exact scenario we’ve been preparing for with the market plummeting to the downside. We want to keep our focus on two major indicators: the 50 simple moving average (SMA) and the Daily Ichimoku Cloud.
In the last year we’ve noticed a common “if, then” rule with these two indicators…
If we don’t hold the 50 SMA, then we drop to the Daily Ichimoku Cloud.
On Monday, we saw exactly what we expected with the S&P 500 (ES) dropping below the 50 SMA and breaching the Daily Ichimoku Cloud. The market could see more trouble moving forward…
If the ES trades below the Daily Ichimoku Cloud for the first time this year, we might see its first bearish trend of 2021.
Rather than try and predict which way the market will go, our job as traders is to read and react based on the information we’re given in the market.
Here is our focused list:
GOOGL — Strongest technology name that started to trend down last week. Watching $2,767 as a key level. If it holds the $2,767 and 50 SMA zone, GOOGL has a strong chance for a reversion to the mean for a dip buy. Looking for a gap fill back to the upside.
ROKU — Relatively strong name holding itself up in the market. Setting up with a tight wedge to the downside. See if ROKU can hold its low from last week at $309 at the bottom of the 4-hour squeeze. If the market works its way higher, ROKU could see a push up for a strong potential long entry. Daily mean is at $340, so look for a push to around $330 to $340.
NVDA — Strong name that is vulnerable to drop, Key level at $208.75 around the 50 SMA, Would love to short NVDA down to the 50 SMA. If we hold the 50 SMA, we could see a gap fill. If we break the 50 SMA below $208.75, look for a drop to $200. If the market keeps dumping, we could even see NVDA drop to $180.
FB — Could be an awesome dip buy now that it is back at the Daily Ichimoku Cloud on its final leg of support around $352. If the market pops, FB could rally to the 50 SMA with a reversion to the mean. If it goes below, FB could head down to $330.